Hengyuan (HY) is a refinery company owned by Shandong HengYuan
Petrochemical company limited, China. It acquired 51% shares from Shell
oversea holding in Dec 2016 for RM300 mil. Let see from 2016 annual
report who are the 30 largest shareholders of HY (after acquisition,
updated to 31 March 2017)


One can observe that there are 3 local reputable institutional funds (Amanahraya, EPF, KWAP) still collectively holding more than 10% shares of HengYuan. Another investor that attracts my attention is Mr Deva Dassan Solomon (no 9, no 14, no 15, no 19 and no 20) holding substantial stake (some are through his family members).
A lot of investors may have bad perception about china controlled listed companies in Malaysia. From its nature of business and the data that I gathered, I think credibility of Hengyuan is NOT an issue at all. You can refer to an article (by Icon88) about Hengyuan at https://klse.i3investor.com/blogs/icon8888/127661.jsp
Fundamental Data
HY’s profit (5 years) and dividend charts can be referred to my another article at https://klse.i3investor.com/blogs/david_petronm/127594.jsp. HY generated 171 sen EPS (Profit before tax). HY can be exempted of paying income tax is due to utilisation of tax losses (deductible temporary). Let revisit HY profit over past 3 years as shown in Figure below:

Its trailing 12-month profit before tax climbing to RM512 mil (171 sen EPS). If we consider about 26% tax rate, then EPS of HY will be around 126.5 sen which lead to PE ratio of 4.57. This is the past data and I am more interested on its future possible profit and PE. Let us have an analysis of HY possible future profit.
Coming quarter Profit Forecast for Q2’17 (April-June 2017)
Let me perform a forecast analysis for their latest Q2’17 (to be released in August) based on its refinery business.
Due to Crude oil price sliding from 31 March as compared to 30 June 2017, it will suffer some inventory stock loss as it should keep around 18-21 days of crude oil stock (18 days crude inventory of 2.2mil barrels is from calculation of quarterly crude oil sold data).
Calculation of profit (including stock loss)
1) Brent Crude oil reference price on 31 Mar17 = 52.95 USD/brl (based on investing.com on 31 March)
On 30 June, Brent oil price closed at = 48.2 USD/brl (based on Brent oil price at Asia time at 11.59pm from Investing.com)
Stock loss = 2.2mil brl x (48.2 - 52)
= USD -8.36mil
= RM-35.95mil
(2.2mil brls are estimated 18 days stock from 10.1 mil barrels sold. Source: Q1’17 report)
2) Refinery margin in a quarter (based on its Q1 estimated throughput per day of 112.2kbpd although its max daily capacity is 156kbpd).
= 10.1mil barrels X USD8.25 (estimated profit margin per barrel)
= USD 83.33mil
= RM 358.30mil
Maybe some of you wonder how I get the refinery margin of USD8.25. Please refer to my 2nd article on Petronm (https://klse.i3investor.com/blogs/david_petronm/127424.jsp) or check on the graph for Singapore Crack Spread (refinery margin) data as below
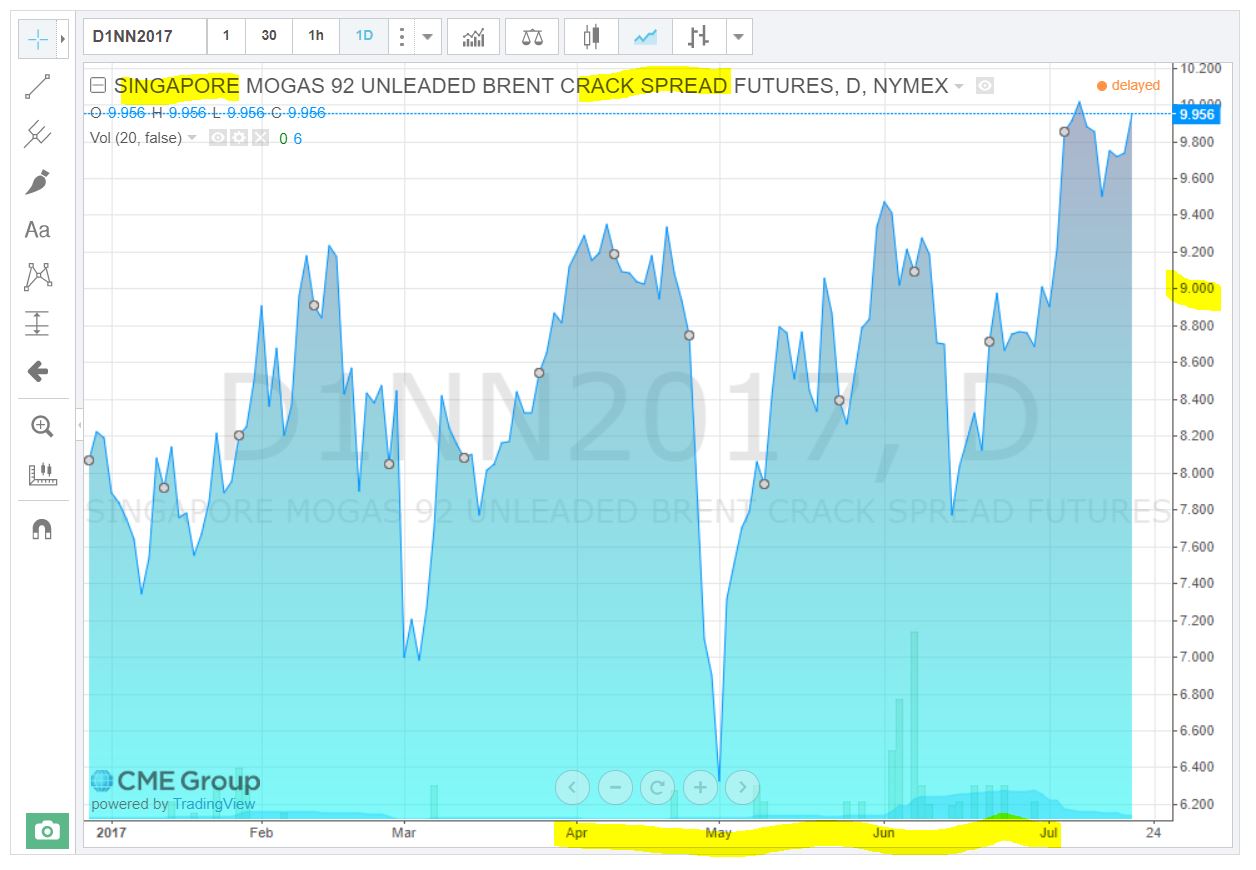
The average data of 3 months crack spread is around USD9.1 and I take the value of USD8.25 is due to I discounted 10% for possible data reading error for higher margin of safety.
Still not convincing enough? Let see some past official refinery margin data from 2016 Hengyuan (former Shell) Annual Report (page 47) as below:
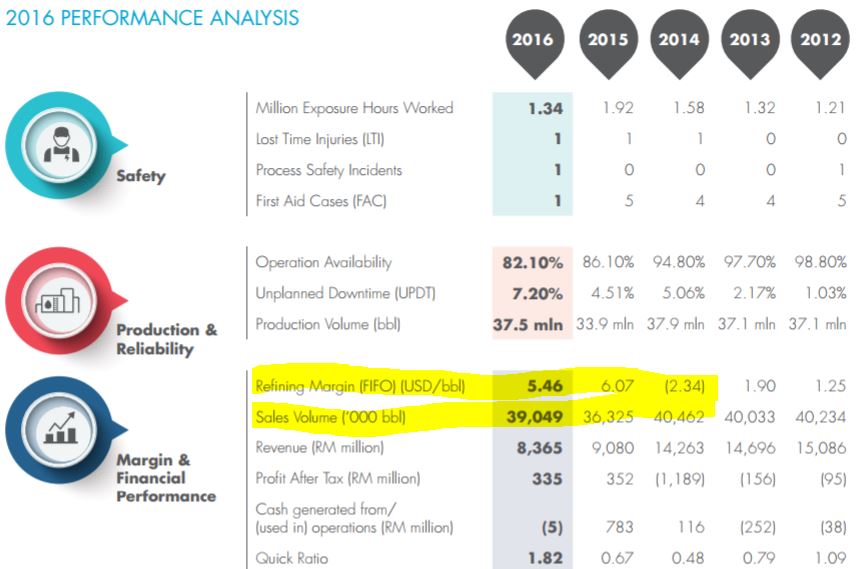
Source: HengYuan 2016 Annual report
From the table above, we can observe that HY’s FIFO (first in first out) margins were USD5.46 per barrel due to higher sales volume in 2016 vs 2015.
A quick comparison of the CME group crack spread chart and the table (2016 AR) we can notice that refinery margin is climbing higher in period of Q1’17 (average is higher than 5.46) that lead to the HengYuan reported a super high net profit of RM279 mil. One can also notice that refinery margin is even higher in Q2’17 (April-June) which is serve as ground support for my refinery profit calculation (358.30mil).
Let calculate the Gross profit of Hengyuan’s Q2’17 as below:
Gross Profit = -35.95+ 358.30
= 322.35mil
Assuming same operating cost, other income and finance cost of RM116.1 mil as per Q1’17 (from Q1 report),
Net Profit = (322.35-116.1) mil = RM206.25 mil.
This net profit has not factored in the highly possible forex gain due to appreciation of RM in Q2.
Assume Zero tax rate as per last quarter (utilize tax losses)
Net profit = RM206.25 mil
RM206.25 mil à EPS of 68.75 sen.
Let see the possible coming 3 quarters result for YoY comparison
2016 and 2017 Quarter Profit
Based on current price of RM5.80 with possible 236.44 sen EPS (3 quarters only),
one can estimate the possible PE for Henyuan after Q3’17 result is
released in Nov 2017 (PE 2.4 or lower if refinery margin can be
maintained).
From Q1’17 and Q4’16 reports, one can notice that HY keeps high level of inventory (increase from 825mil to 1075mil). I will discuss its possible motive of this high level of inventory in next part 2 article.
I think Hengyuan should still have 30-40% upside in term of current market valuation. If refinery margin can be maintained in 2H2017, its upside room is sky high as it can reap super high profit from operation (Shell traded at price of RM8+ to RM10+ from 2011 to Sept 2013, please check the EPS at this period!)
Worry of its high level of debt?
One should notice that HengYuan has RM1,414 mil borrowings (Q1’17 report). We should assess its future earning capability and more importantly its free cash flow from operation to know its ability to pare down its debt.
Let have a look on its latest inventory value (source: HY Q1’17 report)
Inventory value: RM1,075 mil
Receivables = RM960 mil
Payables = RM604 mil
Cash in hand = RM285 mil
One should know that its inventory consist of and crude oil and refined petroleum products (gasoline, diesel etc) which is highly liquidable (can be easily sold in market). If HY really desperate for cash, it can always reduce its inventory level and convert some of them to cash.
In fact, it also has high level of Receivables which if we minus out Payable will has a surplus of RM356 mil.
Total liquid assets = 1075+960-604 = RM1,431 mil
These liquid assets (without considering its cash in hand, lands, PPE etc) actually can settle ALL borrowings of HY with a positive surplus of RM17 mil.
Risk:
1. Stock loss of finished product (gasoline and diesel etc) from frequent price change which is a result of weekly price system (HY employs FIFO system which should have some gain and loss)
2. Big drop in refinery margin which I think is not likely to happen in short term based on my monitoring on Singapore Future price of petroleum finished products (Mogas 95).
3. High volatility of crude oil price (dropping may result in stock loss) while price up will result in stock gain but the loss can be easily offset by higher refinery margin with surplus (from 2015 and 2017 Q1’s results). Crude oil is in decent range (USD43-USD55) which is profitable for refinery player (from increasing refinery crack spread data from CME website)
4. Upgrading plan (RM700 mil) which has been finalized to ensure HY to meet the Euro 4M specifications mandated by the government. The project is planned to be financed mainly from a mix of cash flow generated from operations and a further draw down from an existing term loan. High level of debt can be reduced by foreseeable huge profit and cash flow from operation.
5. This RM700mil upgrade also increase the daily throughput which may further increases its profit and drive down its refinery processing cost per barrel.
Summary
1. We are talking about nearly 40 mil barrels of oil sales volume per annum (AR 2016 data). Imagine if HY can reap a profit margin of USD6 to USD8 per barrels, how much gross profit HY can generate per year?
2. Crude oil price has been stabilizing in the range of USD43 to USD55 in 2017. This paves the room for stable (in fact increasing) refinery margin and I foresee future margin should be sustainable.
3. Due to Ramadan month was in Q2’17 (June), it is expected higher number of land and air travelling which should increase HY’s selling volume (HY major customer is Shell Malaysia)
4. Possibility of increasing its daily refinery throughput will further drive its profit to higher level. Currently HY is running at around 72% of its max daily capacity (156kbpd)
5. Higher future demand of gasoline, diesel, LPG, and aviation fuel from growing vehicle population in Malaysia will provide future growth opportunity in profit for Hengyuan.
6. Buying a counter is buying its future profitability where past FA data is served as reference. Although HY current balance sheet is still not healthy enough, but with lucrative refinery margin in 1H2017, I think it can improve its balance sheet and cash flow by year end.
Stay tune for my Hengyuan’s part 2 report for its free cash flow analysis, motive of its high inventory, ROE, quality of earning, possible foreign exchange gain or loss, valuation analysis and its major customer relationship.
Disclaimer:
This writing is my own imagination for all the assumptions and estimations. It is strictly for sharing purpose, not a buy or sell call of the company.
http://klse.i3investor.com/blogs/davidtslim/128328.jsp
One can observe that there are 3 local reputable institutional funds (Amanahraya, EPF, KWAP) still collectively holding more than 10% shares of HengYuan. Another investor that attracts my attention is Mr Deva Dassan Solomon (no 9, no 14, no 15, no 19 and no 20) holding substantial stake (some are through his family members).
A lot of investors may have bad perception about china controlled listed companies in Malaysia. From its nature of business and the data that I gathered, I think credibility of Hengyuan is NOT an issue at all. You can refer to an article (by Icon88) about Hengyuan at https://klse.i3investor.com/blogs/icon8888/127661.jsp
Fundamental Data
HY’s profit (5 years) and dividend charts can be referred to my another article at https://klse.i3investor.com/blogs/david_petronm/127594.jsp. HY generated 171 sen EPS (Profit before tax). HY can be exempted of paying income tax is due to utilisation of tax losses (deductible temporary). Let revisit HY profit over past 3 years as shown in Figure below:
Its trailing 12-month profit before tax climbing to RM512 mil (171 sen EPS). If we consider about 26% tax rate, then EPS of HY will be around 126.5 sen which lead to PE ratio of 4.57. This is the past data and I am more interested on its future possible profit and PE. Let us have an analysis of HY possible future profit.
Coming quarter Profit Forecast for Q2’17 (April-June 2017)
Let me perform a forecast analysis for their latest Q2’17 (to be released in August) based on its refinery business.
Due to Crude oil price sliding from 31 March as compared to 30 June 2017, it will suffer some inventory stock loss as it should keep around 18-21 days of crude oil stock (18 days crude inventory of 2.2mil barrels is from calculation of quarterly crude oil sold data).
Calculation of profit (including stock loss)
1) Brent Crude oil reference price on 31 Mar17 = 52.95 USD/brl (based on investing.com on 31 March)
On 30 June, Brent oil price closed at = 48.2 USD/brl (based on Brent oil price at Asia time at 11.59pm from Investing.com)
Stock loss = 2.2mil brl x (48.2 - 52)
= USD -8.36mil
= RM-35.95mil
(2.2mil brls are estimated 18 days stock from 10.1 mil barrels sold. Source: Q1’17 report)
2) Refinery margin in a quarter (based on its Q1 estimated throughput per day of 112.2kbpd although its max daily capacity is 156kbpd).
= 10.1mil barrels X USD8.25 (estimated profit margin per barrel)
= USD 83.33mil
= RM 358.30mil
Maybe some of you wonder how I get the refinery margin of USD8.25. Please refer to my 2nd article on Petronm (https://klse.i3investor.com/blogs/david_petronm/127424.jsp) or check on the graph for Singapore Crack Spread (refinery margin) data as below
The average data of 3 months crack spread is around USD9.1 and I take the value of USD8.25 is due to I discounted 10% for possible data reading error for higher margin of safety.
Still not convincing enough? Let see some past official refinery margin data from 2016 Hengyuan (former Shell) Annual Report (page 47) as below:
Source: HengYuan 2016 Annual report
From the table above, we can observe that HY’s FIFO (first in first out) margins were USD5.46 per barrel due to higher sales volume in 2016 vs 2015.
A quick comparison of the CME group crack spread chart and the table (2016 AR) we can notice that refinery margin is climbing higher in period of Q1’17 (average is higher than 5.46) that lead to the HengYuan reported a super high net profit of RM279 mil. One can also notice that refinery margin is even higher in Q2’17 (April-June) which is serve as ground support for my refinery profit calculation (358.30mil).
Let calculate the Gross profit of Hengyuan’s Q2’17 as below:
Gross Profit = -35.95+ 358.30
= 322.35mil
Assuming same operating cost, other income and finance cost of RM116.1 mil as per Q1’17 (from Q1 report),
Net Profit = (322.35-116.1) mil = RM206.25 mil.
This net profit has not factored in the highly possible forex gain due to appreciation of RM in Q2.
Assume Zero tax rate as per last quarter (utilize tax losses)
Net profit = RM206.25 mil
RM206.25 mil à EPS of 68.75 sen.
Let see the possible coming 3 quarters result for YoY comparison
2016 and 2017 Quarter Profit
2016 (mil, EPS in sen)
|
2017 (mil, EPS in sen)
|
|
| Q1 |
101.97, 33.88
|
279.48, 93.16
|
| Q2 |
107.05, 35.56
|
calculated (~206.2,~68.75)
|
| Q3 |
-80.80, -26.95
|
estimated by 80% from Q1’17 profit(~223.84,~ 74.5)
|
| Q4 |
207.04, 69.27
|
?? (depend on refinery margin)
|
| Total |
335.72mil, 111.7
|
estimated 3Q only (~709.26 mil,~ 236.44)
|
From Q1’17 and Q4’16 reports, one can notice that HY keeps high level of inventory (increase from 825mil to 1075mil). I will discuss its possible motive of this high level of inventory in next part 2 article.
I think Hengyuan should still have 30-40% upside in term of current market valuation. If refinery margin can be maintained in 2H2017, its upside room is sky high as it can reap super high profit from operation (Shell traded at price of RM8+ to RM10+ from 2011 to Sept 2013, please check the EPS at this period!)
Worry of its high level of debt?
One should notice that HengYuan has RM1,414 mil borrowings (Q1’17 report). We should assess its future earning capability and more importantly its free cash flow from operation to know its ability to pare down its debt.
Let have a look on its latest inventory value (source: HY Q1’17 report)
Inventory value: RM1,075 mil
Receivables = RM960 mil
Payables = RM604 mil
Cash in hand = RM285 mil
One should know that its inventory consist of and crude oil and refined petroleum products (gasoline, diesel etc) which is highly liquidable (can be easily sold in market). If HY really desperate for cash, it can always reduce its inventory level and convert some of them to cash.
In fact, it also has high level of Receivables which if we minus out Payable will has a surplus of RM356 mil.
Total liquid assets = 1075+960-604 = RM1,431 mil
These liquid assets (without considering its cash in hand, lands, PPE etc) actually can settle ALL borrowings of HY with a positive surplus of RM17 mil.
Risk:
1. Stock loss of finished product (gasoline and diesel etc) from frequent price change which is a result of weekly price system (HY employs FIFO system which should have some gain and loss)
2. Big drop in refinery margin which I think is not likely to happen in short term based on my monitoring on Singapore Future price of petroleum finished products (Mogas 95).
3. High volatility of crude oil price (dropping may result in stock loss) while price up will result in stock gain but the loss can be easily offset by higher refinery margin with surplus (from 2015 and 2017 Q1’s results). Crude oil is in decent range (USD43-USD55) which is profitable for refinery player (from increasing refinery crack spread data from CME website)
4. Upgrading plan (RM700 mil) which has been finalized to ensure HY to meet the Euro 4M specifications mandated by the government. The project is planned to be financed mainly from a mix of cash flow generated from operations and a further draw down from an existing term loan. High level of debt can be reduced by foreseeable huge profit and cash flow from operation.
5. This RM700mil upgrade also increase the daily throughput which may further increases its profit and drive down its refinery processing cost per barrel.
Summary
1. We are talking about nearly 40 mil barrels of oil sales volume per annum (AR 2016 data). Imagine if HY can reap a profit margin of USD6 to USD8 per barrels, how much gross profit HY can generate per year?
2. Crude oil price has been stabilizing in the range of USD43 to USD55 in 2017. This paves the room for stable (in fact increasing) refinery margin and I foresee future margin should be sustainable.
3. Due to Ramadan month was in Q2’17 (June), it is expected higher number of land and air travelling which should increase HY’s selling volume (HY major customer is Shell Malaysia)
4. Possibility of increasing its daily refinery throughput will further drive its profit to higher level. Currently HY is running at around 72% of its max daily capacity (156kbpd)
5. Higher future demand of gasoline, diesel, LPG, and aviation fuel from growing vehicle population in Malaysia will provide future growth opportunity in profit for Hengyuan.
6. Buying a counter is buying its future profitability where past FA data is served as reference. Although HY current balance sheet is still not healthy enough, but with lucrative refinery margin in 1H2017, I think it can improve its balance sheet and cash flow by year end.
Stay tune for my Hengyuan’s part 2 report for its free cash flow analysis, motive of its high inventory, ROE, quality of earning, possible foreign exchange gain or loss, valuation analysis and its major customer relationship.
Disclaimer:
This writing is my own imagination for all the assumptions and estimations. It is strictly for sharing purpose, not a buy or sell call of the company.
http://klse.i3investor.com/blogs/davidtslim/128328.jsp
