Free Cash Flow Analysis
As I mentioned before in my previous article on Petronm (part 3) (https://klse.i3investor.com/blogs/david_petronm/127594.jsp), free cash flow from operation is an important metric for me to measure the quality of a company’s earning. Let us go through Henguan’s free cash flow from operation as below:

Source: Q1’17 report
From the above table, one can notice that operation profit before changes in working capital is RM341mil. This is the actual free cash flow generated from operation before considering the inventory, receivables and payables.
It can be observed that HY reinvested free cash of RM262mil in Q1’17 to its inventory as compared to reducing its inventory level by RM82 mil in Q1’16 (bracket mean amount spent). It also spent RM38mil to reduce its payables and receivable is increased by an amount of RM35mil. As a result, it net cash flow from operation is only RM6.9mil (Q1’17) as compared to RM32mil (Q1’16).
Now we can observe that reducing inventory level can increase the cash flow from operation and increasing inventory level will has opposite effect. You may wonder why HY wants to invest heavily in its inventory instead of paying off its debt.
Let see another cash flow report from previous quarter (Q4’16) as below:

Source: Q4’16 report
From table above, there are free cash flow of RM660mil in Q4’16 from operation before changes in working capital while RM498mil of cash generated in Q4’15.
What I want to show to you from the above table is Shell (now HY) can produce cash from of RM783mil by reducing its inventory by an amount of RM181mil in Q4’15. Similarly, HY also generated RM117mil free cash even it invested RM125mil in its inventory in Q4’16. Alternatively, please refer to the chart below for a general picture of cash flow for HY from 2014-2017 (Q1 only)
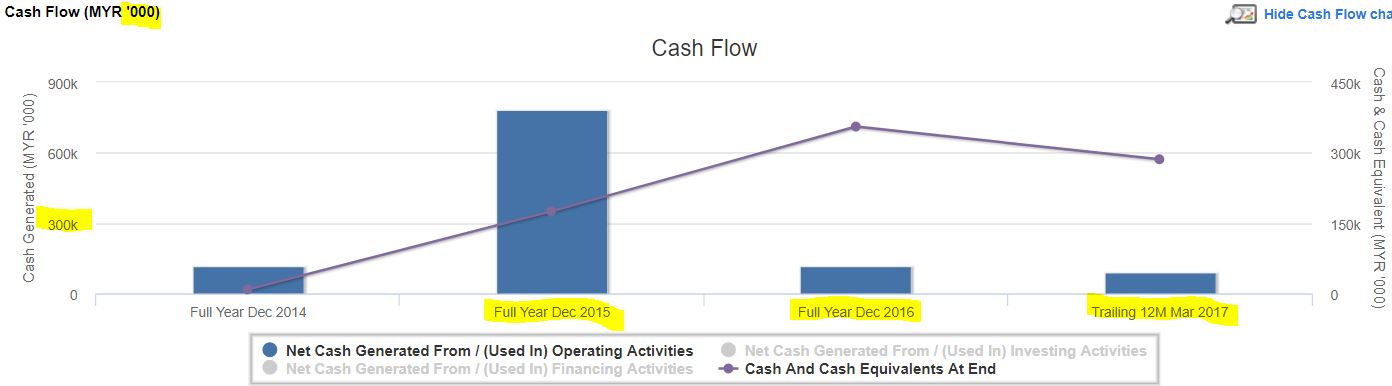
What are the conclusions we can draw from these two tables and the above chart?
1. Free cash flow can be increased by reducing its inventory (mean sell some stock for cash).
2. High quality of earning as it can generate good cash flow from operations (RM117 mil and RM783mil in Q4’15). One may question that RM6.9mil (Q1’17) is low cash flow but bear in mind that the low cash flow is due to HY reinvested RM262mil cash to its inventory. Imagine how much free cash HY able to keep in bank if it just invests a portion from the RM262mil cash to inventory (say RM80mil).
Next, I will discuss its possible motive of keeping high level of inventory.
Motive of High Level of Inventory
As mentioned by my previous article (https://klse.i3investor.com/blogs/davidtslim/128328.jsp), HY keeps inventory of RM1,075 mil. Its inventory should consist of and crude oil and refined petroleum products (Eg. naphtha, gasoline, diesel, heating oil, kerosene). From my imagination or deduction, it may want to increase its daily throughput from 112k bpd (Q1’17) to a higher level in Q2’17. The motivation of this throughput increment is due to 5-year high refined margin (crack spread).
Let us have an assumption of the larger crude oil stock due to higher value of inventory:
Previous HY’s article assumed 18 days stock for about 2.02mil barrels of crude oil (112.2k x 18). If HY wish to increase its throughput by 11% or 12.8kbpbd to 125kbpd, then it needs to keep around 2.25 mil barrels (18 days x 125k) of crude oil stock.
New Profit calculation if throughput is 125kbpd (kilo barrel per day)
New Stock loss = 2.25mil brl x (48.2 – 52.95)
= USD -10.69mil
= RM-45.96mil
New Refinery margin in a quarter (based on its Q1 estimated throughput per day of 125 kbpd)
= 11.25mil barrels X USD8.25 (estimated profit margin per barrel)
= USD 92.81mil
= RM 399.09mil
Let calculate the new Gross profit of Hengyuan’s Q2’17 as below:
Gross Profit = -45.96+ 399.09
= RM353.14mil (assume 125 kbpd)
From previous article (https://klse.i3investor.com/blogs/davidtslim/128328.jsp), gross profit calculated by assuming throughput of 112.2kbpd is = RM317.06mil
So the net increment in gross profit (GP) if throughput 125kbpd
= RM353.14mil - RM317.06mil = RM36.08mil
Let us compare the difference if Hengyuan management keeps the 80% of RM262mil cash to Fixed Deposit in bank (or reduce debt) instead of reinvested in inventory.
From the table above, I leave it to your own judgment whether management’s decision to reinvest RM262 mil cash to inventory is a wise or right decision or not.
Actually RM36.08 mil can increase gross profit of HY by 9.13% based on Q1’17 profit.
In short, my deduction of HY increased its inventory in Q2 is to increase its daily throughput to boost its earning as currently the refinery margin is near to 5-year high.
Return of Equity (ROE) data
ROE is a measure of company's profitability by revealing how much profit a company can generate with the money of shareholders have invested. Formula for ROE is as below:
ROE = Net Profit / Shareholder’s Equity
Let calculate ROE of HY based on its equity and net profit.
A ROE of around 18% is considered good enough, 20% is excellent, and 25% and above is considered superior.
Why I said 25% is superior? It is because this ratio indicates the company is very efficient to generate profit using the shareholder’s money (4 years can earn back our entire invested fund).
ROE of Hengyuan is 40% based on trailing 12-month’s profit and equity. If this ratio can be maintained, one can estimate how long they can earn back shareholder’s fund.
I may discuss other indicators like EV, EV/EBIT and ROIC if deem necessary in my part 3 article of HY.
Prospect
HY’s profit is closely related to refinery margin (crack spread). Why “crack” term is used in refinery industry? It is because refiners buy crude oils and crack them into petroleum products. The differential between the finished products (e.g. gasoline, diesel, jet fuel etc) and the crude oil is called crack spread.
Let see the latest Singapore crack spread chart up to end of July to estimate HY’s visibility of its profit in Q3’17 (July-Sept 17) as below:
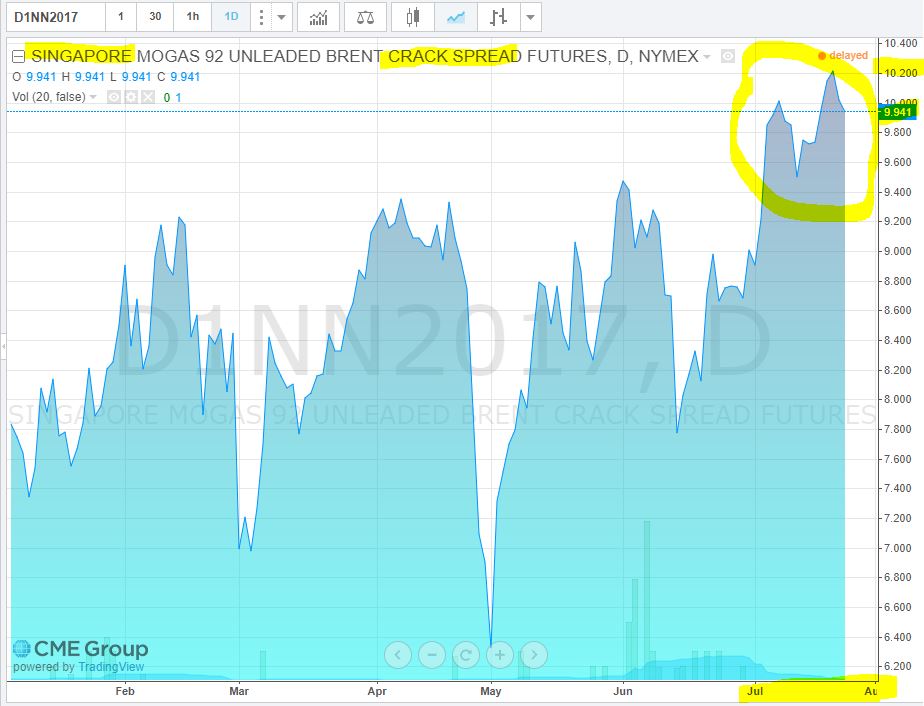
Anyway, this is just up to end July. I may prepare another article for refinery margin estimation if got time in future.
Let us have an overview of all the Malaysia oil refinery players.
1) Hengyuan Port Dickson Refinery, 156 kbpd (24,800 m3/d)
2) Petronas Melaka I Refinery, 100 kbpd (16,000 m3/d) – Not listed
3) Petronas Melaka II Refinery, 170 kbpd (27,000 m3/d) – Not listed
4 ) Petronas Kertih Refinery, 40 kbpd (6,400 m3/d) – Not listed
5) Petronm Port Dickson Refinery, 88 kbpd (14,000 m3/d)
6) TIPCO Kemaman Bitumen Refinery, 30 kbpd (4,800 m3/d) – Not listed
Theoretically Malaysia has maximum daily capacity/throughput of 584 kbpd. Anyway, I guess most of the players did not run at maximum daily capacity. I estimate most of average daily capacity for these players is around 85% (except Petronm) which lead to around 500 kbpd. Of course, I am aware of RAPID project but that is the story of 2019.
Our neighbour, Singapore has 3 refinery plants (owned by Exxon, Shell and Singapore refinery) which collectively have a daily maximum capacity of 1380 kbpd. Based on our country demand data, I believe Malaysia still import refined products from Singapore as our supply is still less than demand.
As some of you may aware, Alibaba (Taobao)’s regional (SEA) distribution hub will be based in KLIA (http://www.reuters.com/article/us-alphabet-results-research-idUSKBN1AA1ON), Malaysia. From this development, I expect future land and air travelling will be increasing that will lead to higher diesel and Jet fuel consumption.
In short, I think the demands in medium term in Malaysia should still have room to grow. In addition, the supply in Asia is also limited due to some scheduled and unexpected maintenance in Asia’s refinery players. Please refer to some supporting news for the above-mentioned maintenance as below:
1. http://jakartaglobe.id/international/asia-gasoline-outshines-jet-fuel-diesel-supply-shrinks/
2. http://www.hydrocarbons-technology.com/news/newsreport-asia-had-highest-refining-capacity-under-maintenance-in-q1-5817585
3. http://timesofindia.indiatimes.com/business/international-business/asia-refinery-2016-2017-maintenance/outages/articleshow/58921267.cms
It is worth noting that refinery operation margin depends on crude oil cost, transportation, factory efficiency, throughput or volume, distribution network, refinery location and simple or complex refined system (HY is a complex refiner).
Let see a latest news on Royal Shell's result boosted by refinery as below:
http://www.thestar.com.my/business/business-news/2017/07/27/shell-profits-triples-on-stronger-refining-and-oil-prices/s/
Summary
1. What I can see from refinery business is a business which has a consistent and slow growing consumption (due to Malaysia vehicle population is growing) and its profit is closely related to crack spread (refinery margin).
2. Stock loss (due to falling of price of crude oil) can be easily offset by refinery profit (as shown in my earlier calculation) with positive surplus based on current refinery margin.
3. Again, I would like to stress that refinery business is a highly recursive business and super low labour-dependent as compared to other non-continuous business revenue (Eg. construction sector depends on contract), where the management skills, competency, weather, material costs, labour supply where all of them play an integrated role which is sometime unpredictable.
4. HY’s Q2 high level of inventory may lead to a possibility of its daily refinery throughput increment which should further drive its Q2 profit to a higher level.
5. To reap profit from stock market, one good practice is buy a good company at CHEAP price and SELL it when it is already fully valued. For me, LOW in PRICE ≠ CHEAP, HIGH in PRICE ≠ EXPENSIVE. It is all depend on future earnings visibility per share and cash flow from operation. (Reason for high in price is due to profit keeping increasing but total no of shares remain intact)
For those interested on technical analysis on Hengyuan, please refer to the chart below where I can notice a broke out and uptrend momentum signal. DE (Deviation Expert) signal shows a positive inflow fund with two Red bars on 25 and 26 July (mean fund inflows > outflows). The Red bar on 26 July is longer than previous day also indicates stronger inflow fund which correlates well with price action.

Stay tune for my Hengyuan’s Part 3 article for its possible foreign exchange gain or loss, further cash flow and debt analysis, valuation analysis etc.
You can get my latest update on share analysis at Telegram Channel ==> https://t.me/davidshare
Disclaimer:
This writing is my own imagination for all the assumptions and estimations. It is strictly for sharing purpose, not a buy or sell call of the company.
http://klse.i3investor.com/blogs/davidtslim/128681.jsp
As I mentioned before in my previous article on Petronm (part 3) (https://klse.i3investor.com/blogs/david_petronm/127594.jsp), free cash flow from operation is an important metric for me to measure the quality of a company’s earning. Let us go through Henguan’s free cash flow from operation as below:
Source: Q1’17 report
From the above table, one can notice that operation profit before changes in working capital is RM341mil. This is the actual free cash flow generated from operation before considering the inventory, receivables and payables.
It can be observed that HY reinvested free cash of RM262mil in Q1’17 to its inventory as compared to reducing its inventory level by RM82 mil in Q1’16 (bracket mean amount spent). It also spent RM38mil to reduce its payables and receivable is increased by an amount of RM35mil. As a result, it net cash flow from operation is only RM6.9mil (Q1’17) as compared to RM32mil (Q1’16).
Now we can observe that reducing inventory level can increase the cash flow from operation and increasing inventory level will has opposite effect. You may wonder why HY wants to invest heavily in its inventory instead of paying off its debt.
Let see another cash flow report from previous quarter (Q4’16) as below:
Source: Q4’16 report
From table above, there are free cash flow of RM660mil in Q4’16 from operation before changes in working capital while RM498mil of cash generated in Q4’15.
What I want to show to you from the above table is Shell (now HY) can produce cash from of RM783mil by reducing its inventory by an amount of RM181mil in Q4’15. Similarly, HY also generated RM117mil free cash even it invested RM125mil in its inventory in Q4’16. Alternatively, please refer to the chart below for a general picture of cash flow for HY from 2014-2017 (Q1 only)
What are the conclusions we can draw from these two tables and the above chart?
1. Free cash flow can be increased by reducing its inventory (mean sell some stock for cash).
2. High quality of earning as it can generate good cash flow from operations (RM117 mil and RM783mil in Q4’15). One may question that RM6.9mil (Q1’17) is low cash flow but bear in mind that the low cash flow is due to HY reinvested RM262mil cash to its inventory. Imagine how much free cash HY able to keep in bank if it just invests a portion from the RM262mil cash to inventory (say RM80mil).
Next, I will discuss its possible motive of keeping high level of inventory.
Motive of High Level of Inventory
As mentioned by my previous article (https://klse.i3investor.com/blogs/davidtslim/128328.jsp), HY keeps inventory of RM1,075 mil. Its inventory should consist of and crude oil and refined petroleum products (Eg. naphtha, gasoline, diesel, heating oil, kerosene). From my imagination or deduction, it may want to increase its daily throughput from 112k bpd (Q1’17) to a higher level in Q2’17. The motivation of this throughput increment is due to 5-year high refined margin (crack spread).
Let us have an assumption of the larger crude oil stock due to higher value of inventory:
Previous HY’s article assumed 18 days stock for about 2.02mil barrels of crude oil (112.2k x 18). If HY wish to increase its throughput by 11% or 12.8kbpbd to 125kbpd, then it needs to keep around 2.25 mil barrels (18 days x 125k) of crude oil stock.
New Profit calculation if throughput is 125kbpd (kilo barrel per day)
New Stock loss = 2.25mil brl x (48.2 – 52.95)
= USD -10.69mil
= RM-45.96mil
New Refinery margin in a quarter (based on its Q1 estimated throughput per day of 125 kbpd)
= 11.25mil barrels X USD8.25 (estimated profit margin per barrel)
= USD 92.81mil
= RM 399.09mil
Let calculate the new Gross profit of Hengyuan’s Q2’17 as below:
Gross Profit = -45.96+ 399.09
= RM353.14mil (assume 125 kbpd)
From previous article (https://klse.i3investor.com/blogs/davidtslim/128328.jsp), gross profit calculated by assuming throughput of 112.2kbpd is = RM317.06mil
So the net increment in gross profit (GP) if throughput 125kbpd
= RM353.14mil - RM317.06mil = RM36.08mil
Let us compare the difference if Hengyuan management keeps the 80% of RM262mil cash to Fixed Deposit in bank (or reduce debt) instead of reinvested in inventory.
|
|
Keep in FD (3% interest) |
Reinvest in inventory |
Difference |
|
Gross Profit from RM262 mil cash |
RM6.28 mil per year from interests Converted to 90 days interests = RM1.57mil |
GP = 353.14-317.06 = RM36.08mil |
ROI in FD is 3% ROI in reinvestment = 55% ROI = return on investment |
From the table above, I leave it to your own judgment whether management’s decision to reinvest RM262 mil cash to inventory is a wise or right decision or not.
Actually RM36.08 mil can increase gross profit of HY by 9.13% based on Q1’17 profit.
In short, my deduction of HY increased its inventory in Q2 is to increase its daily throughput to boost its earning as currently the refinery margin is near to 5-year high.
Return of Equity (ROE) data
ROE is a measure of company's profitability by revealing how much profit a company can generate with the money of shareholders have invested. Formula for ROE is as below:
ROE = Net Profit / Shareholder’s Equity
Let calculate ROE of HY based on its equity and net profit.
|
Year |
2016 (Q1-Q4) |
2017 (Q1’17, Q2-Q4’16) |
Growth |
|
Net profit |
335 mil |
513 mil |
53% |
|
Equity |
1010.4 mil |
1274.8 mil |
26% |
|
ROE |
33% |
40% |
21% |
Why I said 25% is superior? It is because this ratio indicates the company is very efficient to generate profit using the shareholder’s money (4 years can earn back our entire invested fund).
ROE of Hengyuan is 40% based on trailing 12-month’s profit and equity. If this ratio can be maintained, one can estimate how long they can earn back shareholder’s fund.
I may discuss other indicators like EV, EV/EBIT and ROIC if deem necessary in my part 3 article of HY.
Prospect
HY’s profit is closely related to refinery margin (crack spread). Why “crack” term is used in refinery industry? It is because refiners buy crude oils and crack them into petroleum products. The differential between the finished products (e.g. gasoline, diesel, jet fuel etc) and the crude oil is called crack spread.
Let see the latest Singapore crack spread chart up to end of July to estimate HY’s visibility of its profit in Q3’17 (July-Sept 17) as below:
Anyway, this is just up to end July. I may prepare another article for refinery margin estimation if got time in future.
Let us have an overview of all the Malaysia oil refinery players.
1) Hengyuan Port Dickson Refinery, 156 kbpd (24,800 m3/d)
2) Petronas Melaka I Refinery, 100 kbpd (16,000 m3/d) – Not listed
3) Petronas Melaka II Refinery, 170 kbpd (27,000 m3/d) – Not listed
4 ) Petronas Kertih Refinery, 40 kbpd (6,400 m3/d) – Not listed
5) Petronm Port Dickson Refinery, 88 kbpd (14,000 m3/d)
6) TIPCO Kemaman Bitumen Refinery, 30 kbpd (4,800 m3/d) – Not listed
Theoretically Malaysia has maximum daily capacity/throughput of 584 kbpd. Anyway, I guess most of the players did not run at maximum daily capacity. I estimate most of average daily capacity for these players is around 85% (except Petronm) which lead to around 500 kbpd. Of course, I am aware of RAPID project but that is the story of 2019.
Our neighbour, Singapore has 3 refinery plants (owned by Exxon, Shell and Singapore refinery) which collectively have a daily maximum capacity of 1380 kbpd. Based on our country demand data, I believe Malaysia still import refined products from Singapore as our supply is still less than demand.
As some of you may aware, Alibaba (Taobao)’s regional (SEA) distribution hub will be based in KLIA (http://www.reuters.com/article/us-alphabet-results-research-idUSKBN1AA1ON), Malaysia. From this development, I expect future land and air travelling will be increasing that will lead to higher diesel and Jet fuel consumption.
In short, I think the demands in medium term in Malaysia should still have room to grow. In addition, the supply in Asia is also limited due to some scheduled and unexpected maintenance in Asia’s refinery players. Please refer to some supporting news for the above-mentioned maintenance as below:
1. http://jakartaglobe.id/international/asia-gasoline-outshines-jet-fuel-diesel-supply-shrinks/
2. http://www.hydrocarbons-technology.com/news/newsreport-asia-had-highest-refining-capacity-under-maintenance-in-q1-5817585
3. http://timesofindia.indiatimes.com/business/international-business/asia-refinery-2016-2017-maintenance/outages/articleshow/58921267.cms
It is worth noting that refinery operation margin depends on crude oil cost, transportation, factory efficiency, throughput or volume, distribution network, refinery location and simple or complex refined system (HY is a complex refiner).
Let see a latest news on Royal Shell's result boosted by refinery as below:
http://www.thestar.com.my/business/business-news/2017/07/27/shell-profits-triples-on-stronger-refining-and-oil-prices/s/
Summary
1. What I can see from refinery business is a business which has a consistent and slow growing consumption (due to Malaysia vehicle population is growing) and its profit is closely related to crack spread (refinery margin).
2. Stock loss (due to falling of price of crude oil) can be easily offset by refinery profit (as shown in my earlier calculation) with positive surplus based on current refinery margin.
3. Again, I would like to stress that refinery business is a highly recursive business and super low labour-dependent as compared to other non-continuous business revenue (Eg. construction sector depends on contract), where the management skills, competency, weather, material costs, labour supply where all of them play an integrated role which is sometime unpredictable.
4. HY’s Q2 high level of inventory may lead to a possibility of its daily refinery throughput increment which should further drive its Q2 profit to a higher level.
5. To reap profit from stock market, one good practice is buy a good company at CHEAP price and SELL it when it is already fully valued. For me, LOW in PRICE ≠ CHEAP, HIGH in PRICE ≠ EXPENSIVE. It is all depend on future earnings visibility per share and cash flow from operation. (Reason for high in price is due to profit keeping increasing but total no of shares remain intact)
For those interested on technical analysis on Hengyuan, please refer to the chart below where I can notice a broke out and uptrend momentum signal. DE (Deviation Expert) signal shows a positive inflow fund with two Red bars on 25 and 26 July (mean fund inflows > outflows). The Red bar on 26 July is longer than previous day also indicates stronger inflow fund which correlates well with price action.
Stay tune for my Hengyuan’s Part 3 article for its possible foreign exchange gain or loss, further cash flow and debt analysis, valuation analysis etc.
You can get my latest update on share analysis at Telegram Channel ==> https://t.me/davidshare
Disclaimer:
This writing is my own imagination for all the assumptions and estimations. It is strictly for sharing purpose, not a buy or sell call of the company.
http://klse.i3investor.com/blogs/davidtslim/128681.jsp
