Wave Principle and The Fibonacci Sequence
Elliot Wave Principle, one of the most well known technical school
tell us how market move and price structure have certain wave pattern. A
short introduction about Elliot wave as follow:
Elliott Wave Theory was
developed by R.N. Elliott and popularized by Robert Prechter. This
theory asserts that crowd behavior ebbs and flows in clear trends. Based
on this ebb and flow, Elliott identified a certain structure to price
movements in the financial markets. The article serves as a basic
introduction to Elliott Wave Theory. A basic 5-wave impulse sequence and
3-wave corrective sequence are explained. While Elliott Wave Theory
gets much more complicated than this 5-3 combination. (Source: Stockchats.com)
We must give credit to what Elliot Discovered in the market and giving
definition on how the wave construct. The discovery provide the
foundation for many analyst to extend his research. And i am one of
them. However, Elliot Wave theory is not something create by Elliot, but
a discovery from the price movement.
In Robert Prechter book’s chapter 3, the relationship between wave and
the golden ratio are clearly explained. The market certainly move in
the Fibonacci sequence (2, 3, 5, 8, 13). If you can recall, a 5 wave up,
3 wave correction are the Fibonacci number. If you found extension in
the third wave, the total impulsive wave will be 8 wave, 8 is another
Fibonacci number. Here is a example on 2008 bear run.
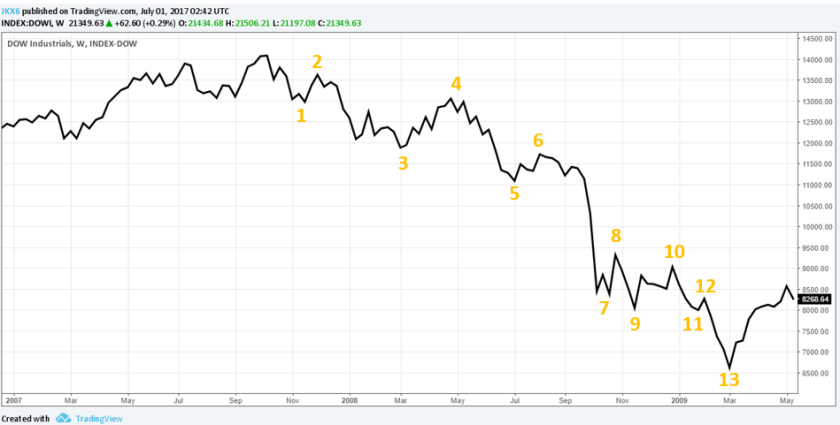
In the above Dow weekly chart, you can clearly see that, the odds
numbers were the impulsive wave (the primary trend of the market), and
the evens numbers represent the correction wave of the bear market. The
market hit the bottom in the thirteen wave. 13 lower low and lower high
structure in the entire bear run, and clearly, 13 is a Fibonacci number.
The bear run finished in 13 lower low lower high waves and market
resume the up trend right after.
In more details price structure….
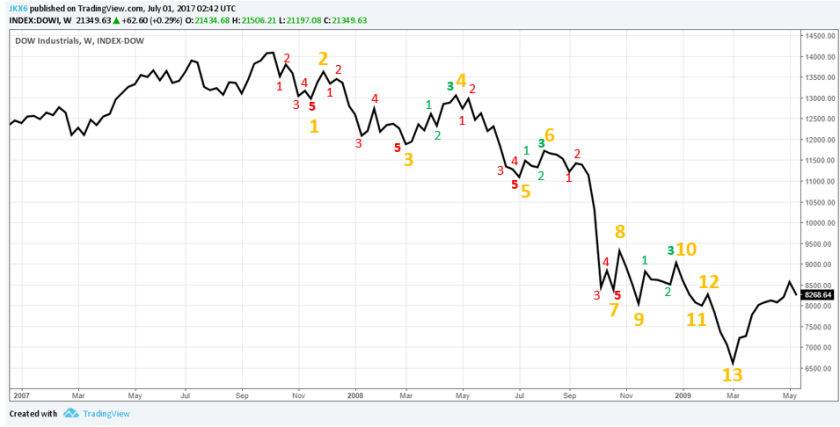
The impulsive wave 1, 3, 5, 7 all moved with 5 minor waves. And
correction waves 4, 6, 10 moved with 3 minor waves structure. Again,
number 5 and 3 are Fibonacci number in the sequence. If you add up the
total minor waves, it will be 35 waves (extensions in minor waves were
excluded). And, 35 just 1 number shy from another Fibonacci number 34.
Clearly, price move in way like the natural phenomena.
How about wave structure in Daily chart.
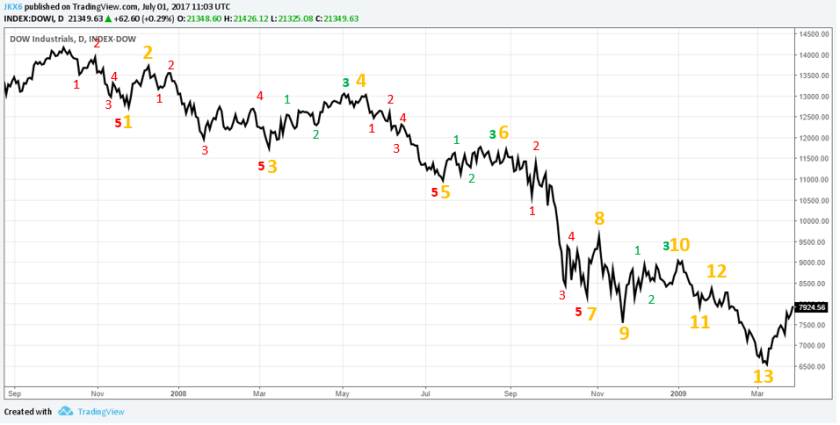
Now, you can see each minor waves in red were formed by minute waves
(see table below on wave degree label). If you try to count some of the
minute waves, you will found minute waves move in 3 or 5 or even 8
Fibonacci sequence.

Source: Elliot Wave Principle
The above 3 Dow Jones charts were using a completed down cycles for
illustration purpose, obviously, if you zoom out from 2007 & 2008
Dow Jones chart, the down cycles was a correction in a up Super cycle.
If you are interested to know more on the wave labeling in Dow, Robert
Prechter book give better view.
I bought Robert Prechter book in Kinokunia back to 2013. The reason i
want to learn about wave principle because in 2013 Crude Palm Oil chart,
i saw the market move in a certain sequence (5 wave up for the bull
market and 3 waves down in some correction). I was using Fibonacci at
that time, without the wave theory in my analysis. But that observation
was precious and it drive me into wave principles.
I don’t usually count wave, even we can observe every swing will end at one of the number stated in Fibonacci Sequence.
It will be difficult to count wave in a real time basis, and you really
need to recount if your first wave assumption was wrong. That make the
analysis subjective and not realistic in taking trades. But i will count
on a completed swing like this for case study purpose. In real time
analysis, as long as i know what trend is impulsive and what trend is
correction. I am good to go.
At last, some personal view on using wave principle in price analysis:
- Wave principle tell us price move in ebb and tide like the water flow.
- Ebb in price is clear and sharp, was defined as trending, impulsive wave or primary trend in the market.
- Tide in price can be sharp or mixed, was defined as non trending, side way, correction waves or secondary trend in the market.
- You can see choppy price swing, forming kind of chart patterns, and this is correction waves.
- If you are researching long term price chart, period that more than 10 years, or price have big movement previously (like bit coin) using log price scale chat on analysis is prefer.
- Never assume the next wave sequence, because price structure move in the sequence of 1, 3, 5, 8, 13. The current swing will not reverse after a 5 wave structure and moving in a 3 waves sequence later.
- In analysis, not necessary to apply wave count for better edge in trading. As long as you know the current price structure is impulsive wave, or is structure in a correction wave. Then, trade with the suitable trading strategies and apply the correct money management in different stages of market. For example, trend following system work better in trending market, but have more noise in non trending market. Range trading strategies work better in side way market.
- The accuracy of using wave principle in price analysis strongly rely on user experience and understanding. Wave principle is more than 1+1=2. It is dynamic and adaptive.
Follow blooger on https://sixty1eight.wordpress.com
Facebook Page Sixty1Eight
