Author: davidtslim | Publish date:
Another perspective to view HY Q2 result
I believe most of the people invest in share market are to make money. How to know a company really makes money from business for us (shareholders) or just producing accounting profit? Many investors just see accounting profit as their buying/selling reference. I can give you two examples of listed companies which show high or positive accounting profit that do not make sense for me. First example is KNM and second example is EG Industries (NO OFFENCE for KNM and EG shareholders as I just want to give examples) which are quite often showing good accounting profit but negative free cash flow (FCF).
What will happen if a company has continuous negative FCF over long run? It may need to take loan from bank, right issue, private placement, issue loan stock (LA) etc. Please go to check how many time KNM (for acquisition) and EG (for expansion) proposed and exercised Right Issues in the past 5 years.
If a company reported a lower than expected accounting profit but generating high FCF, what will happen? This will drive cash in hand (banks) to increase and this would be more make sense for me. In fact, I believe positive FCF is important for sustainability of a business except for companies that are in big expansion and acquisitions. Big expansion or acquisition may have negative impact or risk if the projected earnings from expansion did not materialize.
From the latest HengYuan released result, it reported a net profit of RM81 mil (EPS of 29 sen) for second quarter (Q2) of 2017 (drop 21% YoY). Many investors should be quite disappointed with this result and think this is a poor result. But is it really a disappointed result? I don’t think so. Let me show you some of my justifications that the result is not so bad as what some of you may think.
First Justification:
Lower accounting profit but much higher FCF from operation. Let see how much cash flow generated from operation in the past 6 months for HengYuan (HY) as below:
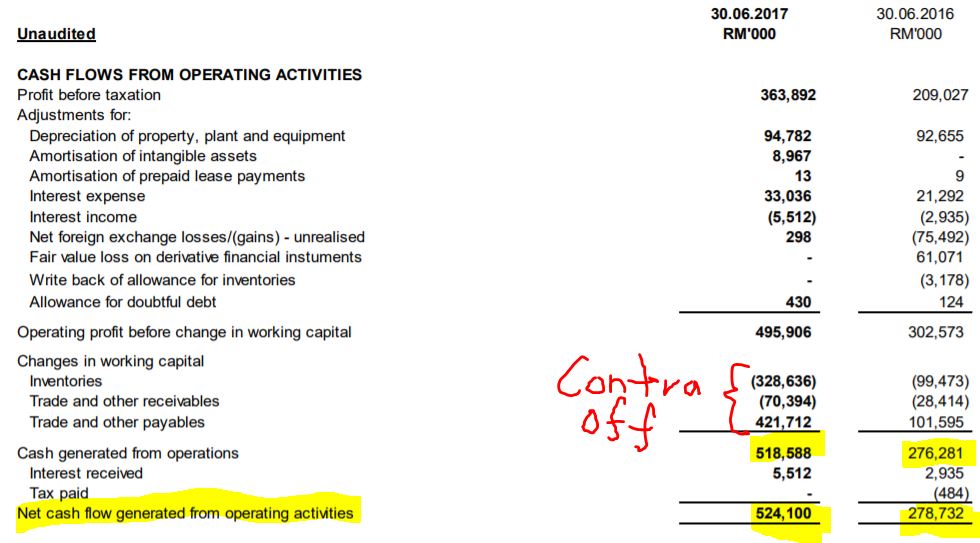
Source: Q2 report
HY has generated RM524 mil cash from operation in a period of 6 months. This is achieved without any disposal gain. Let see how much cash has been used to pay loan in the past 6 months as below:
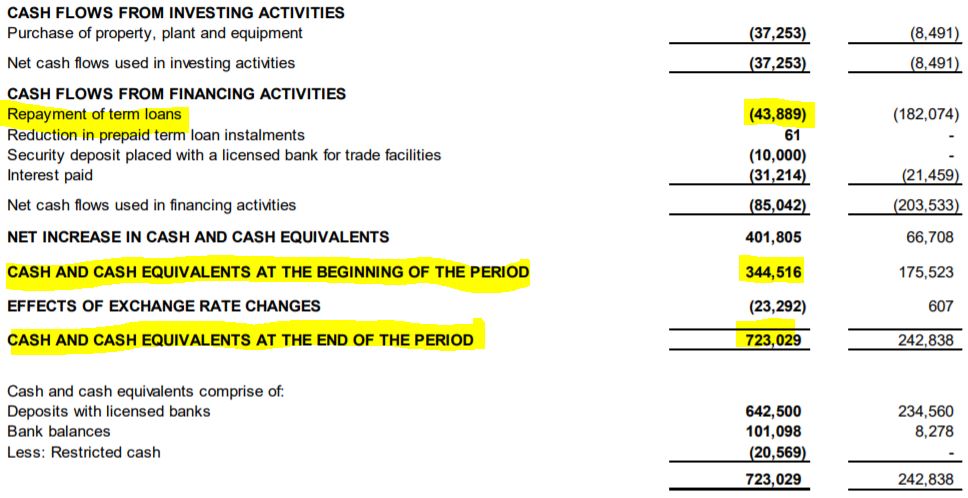
Source: Q2 report
From the table above, HY has paid RM43 mil of term loans (5% of USD200 mil loan) and has increased its cash in hand from RM344 mil to RM723 mil in the period of 6 months (cash in hand at the end of Q1 actually is RM285).
It is worth noting that the huge cash flow increment is achieved at the same time the inventory level is increased and repayment of term loan of RM43 mil. Let see how much the inventory level or value of HY as below:
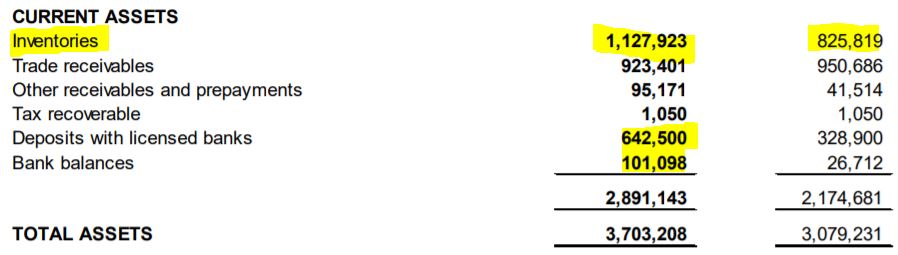
Source: Q2 report
Normally when a company increases their inventory level, their cash flow should decreases but HY can achieve both at the same time which I believe is due to relatively good profit margin from operation and some unrealized stock loss.
How high this cash flow as compared to others?
Let us compare with a company called Panany (Panasonic Manufacturing Malaysia Berhad) which is known for their high level of cash flow and high payout of dividend as below:
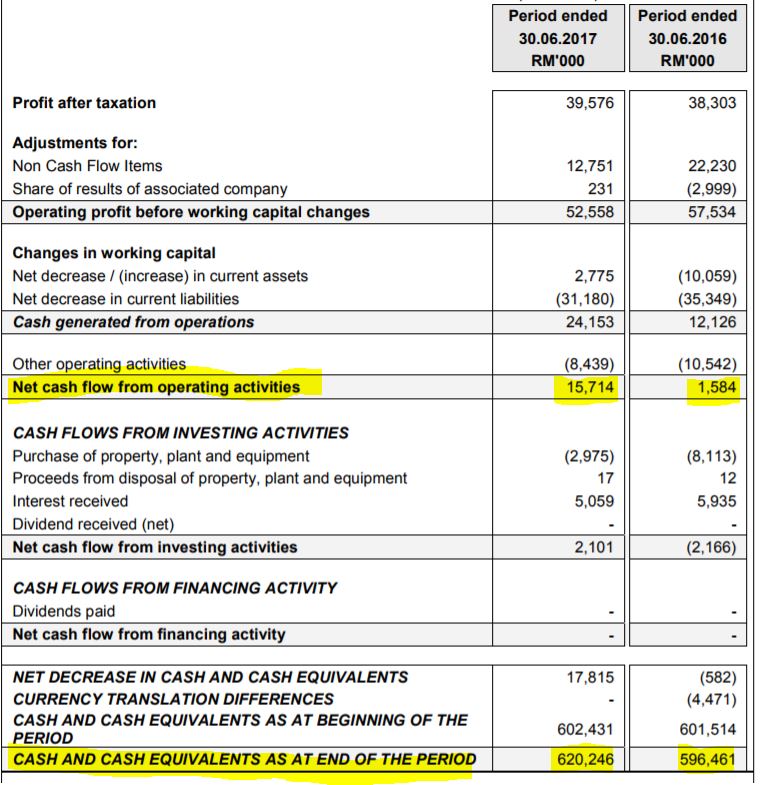
Source: Q2 Panamy report
Panamy has cash in hand of RM620 mil by end of Q2’17 and FCF from operation is about RM15 mil in the period of 6 months.
Let us compare cash per share and price/cash per share ratio for both HY and Panamy as below:
HengYuan
|
Panamy
|
|
| Cash in Hand per share (cash/ total no of shares) |
2.41
|
10.21
|
| Price/Cash per share ratio (based on RM7.43 for HY and RM38.5 for Panamy |
3.08
|
3.77
|
It is worth noting that Hengyuan generated RM524 mil cash flow within 6 months while Panamy may take over 5 years to generate over RM200 free cash flow (can refer to Panamy’s Q3’12 report for cash in hand).
How strong this cash level as compared to Hengyuan market capital? If we assume Hengyuan can continue to generate another RM524 mil cash in second half of 2017 (which is likely in view of current margin), then total cash generated from operation per year is RM1048 mil. How strong this cash generation level if majority shareholders intend to buy out the whole company?
The whole market capital for Hengyuan is just RM2.2 billion (based on RM7.43)
Time needed to buy out the whole company using Cash Flow from Operation
= 2200 mil / 1048 mil = 2.1 years
This means if someone manages to privatize this company, he can get back all his invested capital in 2.1 years using the cash flow from operation (with assumption of zero capex). It is worth noting that the company (HengYuan) that someone manages to privatize is a company with inventory value of RM1127 mil which can pare down up to 91% of its total borrowings of RM1232 mil. (Even with RM350 mil capex for upgrade/maintenance per year, someone still manage to buy out the whole company in 3 years time)
This is not to forget that Hengyuan actually owns a lot of super undervalue lands throughout Malaysia. Remember Petronm just disposed a land in Q2’17 which realized RM39 mil disposal gain (due to much lower land book value).
In short, the high quality of Hengyuan earning is supported by strong FCF from operation of RM524 mil as compared to accounting profit of RM363.8 mil (Q1 – 279.4 + Q2 – 81.4).
Second Justification - Actual accounting profit could be much higher if we remove a few one-off items
One may notice Hengyuan operation profit is affected by Forex loss, inventory loss, extra factory expenses, amortization and loss due to 3 weeks planned maintenance. Let see from the table below how much the actual operation profit if we remove some of these one-off items (some are unrealized like inventory loss and forex loss).
Q2’17 (mil)
|
|
| Original accounting profit |
81
|
| Forex loss |
24
|
| Extra manufacturing expenses |
20
|
| Inventory loss (unrealized) – Estimated by 2.8 mil barrels X 1.71 X 4.3 |
20.6
|
| Loss due to distillers planned minor maintenance (sales drop by 300k barrels) – estimated by 300kXUSD8X4.3 |
10.3
|
| Total profit if one-off items cost are removed |
155.9 mil
|
Third Justification - High Inventory level from Q2 report
I particularly like Hengyuan’s high inventory level in the booming time of Crack spread (refinery margin). I believe only with high enough inventory then only you can make high enough profit under current crack spread level. This is not to mention that HY likely to record inventory gain if crude oil stays above USD48 in the end of September.
In fact, Hengyuan has increased their inventory value from RM825 mil to RM1127 mil within 6 months time (refer Q2’17 report). At the same time, their cash flow is still improved by RM525 mil even they have spent a lot of cash to increase their inventory. It is worth noting that they have suffered inventory loss in the previous two quarters but all these can be offset by high profit margin (high crack spread) in Q1 and Q2 of 2017.
Still not convincing enough that their profit margin is high in Q2 and Q1? Let see what are the review comments from their Q2 report as below:
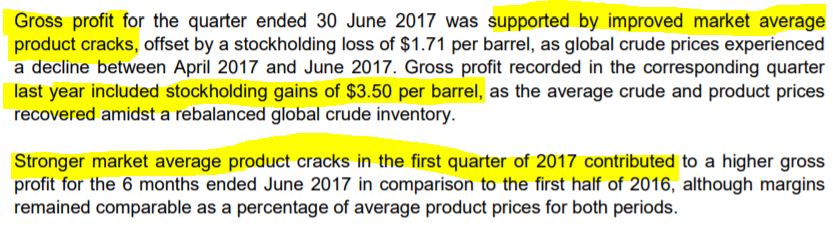
Source: Q2’17 report
In short, their profit margin is highly depending on product crack spread. What can we expect for Q3 profit in view of current gasoline crack spread (refinery margin) reaches 5 years high in Aug 2017? It could be significant increment in HY gross profit margin if they can maintain similar throughput of 112kbpd (as per Q1).
From all my three justifications, I view HengYuan Q2 result (EPS of 29 sen - RM81 mil) is considerable good under many negative factors (planned 3 weeks shut down) which some of them are one-off items (stock loss, forex loss, extra factory maintenance expenses)
I may cover my view on possible dividend distribution in 2018, its debt structure and valuation analysis in my part 5 report.
Let us calculate how much gross profit (GP) per day for HY based on USD10 crack spread
GP = USD10X4.3 X 112k = RM4.82 mil
Even we assume they got shut down of 20 days in Q3, then GP = RM482 mil X 70 days = RM337.1 mil
Key Catalyst: High Product spread (Q3’17 vs Q2’17 vs Q3’16) which is main profit driver
Risk
1. Inventory/stock loss from crude oil price dropping. This is
not likely to happen as current Brent crude oil price stays above USD48.
In fact, it maybe able to record a stock gain if Brent oil price stayed above USD48 in the end of Sept.
2. Big drop in refinery margin which I think is not likely to
happen in short term based on my monitoring on Singapore Future crack
spread of refined finished products (Mogas 92).
1. First strength: Hengyuan profit is closely related to gasoline and other products crack spread (refinery margin). Its gross profit is quite predictable just by monitoring the product future spread data.
2. Second strength: Hengyuan major customer is Shell and they got export 10% of their product to Singapore. Their business is very recursive and there is also possibility of export to china. In short, demand for their products is not an issue.
3. Third strength: Low risk of debt impairment as their customer is international oil giant (Shell)
4. Forth Strength: High profit visibility in Q3 from the fact of high average crack spread data and possible inventory gain
5. Fifth strength: High Free Cash Flow from operation which I would say it is like a CASH printing machine if refinery margin can be sustained at USD9 or above.
6. In my opinion, the possibility of another planned maintenance is low in Q3 as they just have it in Q2. Even we assume there are 22% of down time due to maintenance in Q3, the gross profit that I can calculate for HY is still very lucrative.
Before I end my report, let see some of the recent news on damages caused by US Harvey hurricane on its refinery facilites
https://www.cnbc.com/2017/08/27/hurricane-harvey-refineries-shutting-down.html
http://www.foxbusiness.com/features/2017/08/27/exxon-shutting-major-houston-area-refinery.html
http://www.rigzone.com/news/oil_gas/a/151547/US_Traders_Seek_Oil_Product_Cargoes_from_NAsia_After_Harvey_Sources
You can get my latest update on share analysis at Telegram Channel ==> https://t.me/davidshare
Disclaimer:
This writing is based on my own assumptions and estimations. It is strictly for sharing purpose, not a buy or sell call of the company.

http://klse.i3investor.com/blogs/davidtslim/131336.jsp
