Author: YiStock | Publish date: Sat, 26 Aug 2017, 10:59 AM

An Update:
Key Observation (red arrow)
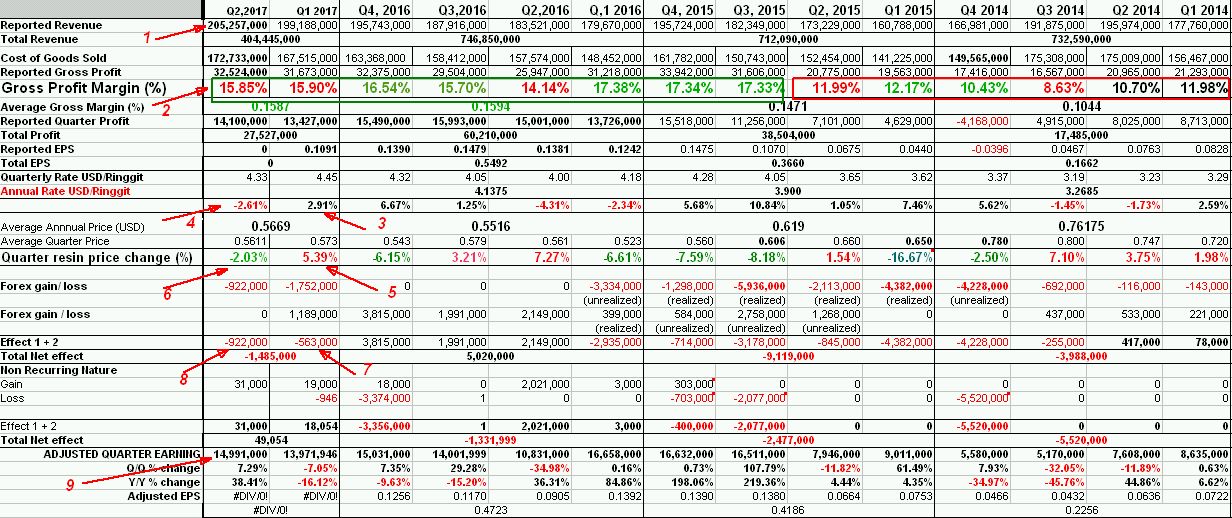
(1) Revenue for the first time break above RM 200 million per quarter and touches RM 205 mil per quarter. The breakthrough carry very significant meaning as Thong Guan has been continue to increase the production capacity to cater the rising demand.
Note: I must make sure that the increase in the Revenue is due to actual production volume and not only due to increase in selling price. Please search previous article for more detail explanation. ( no. 6 above show a slight reduction on average resin price in quarter 2)
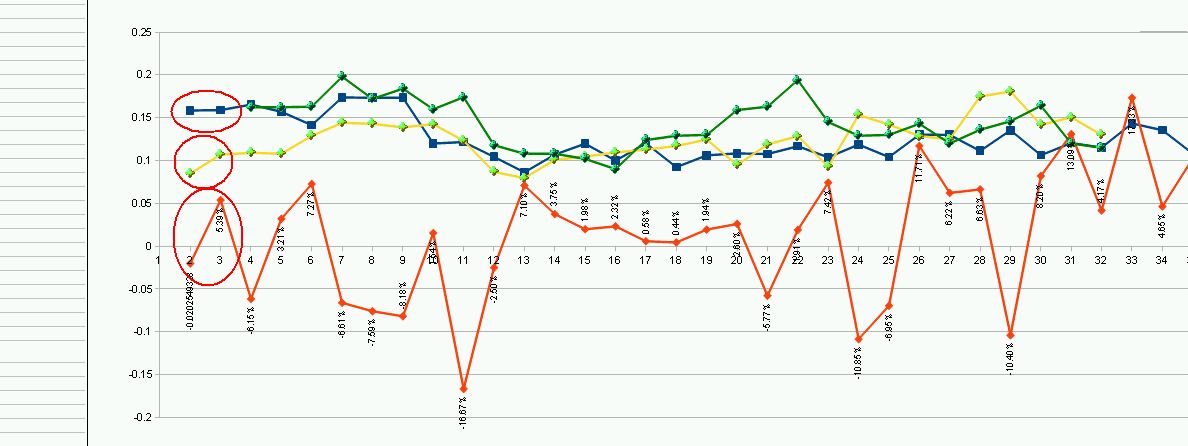
(2) Gross Profit has been stablising around 15.9% for the past 2 quarters. By now everyone should know how Thong Guan react to the fluctuation of resin price and how fast the cost-pass-through by Thong Guan. Below i show the chart again. Green line is company X, blue line is Thong Guan, yellow line is bpplas. Bottom red line is THE % CHANGE of resin as reference. Q1 2017 resin up substantial (refer arrow no. (5) above) , thong guan gross margin down (reflect immediate), BPplas drop a little (lag by 1 quarter generally). Q2 2017 resin price down about 2% (refer arrow no.(6), thong guan gross margin stable, but BPPLAS gross margin dive. That probably explain why BPPlas result dive further in Q2 2017.
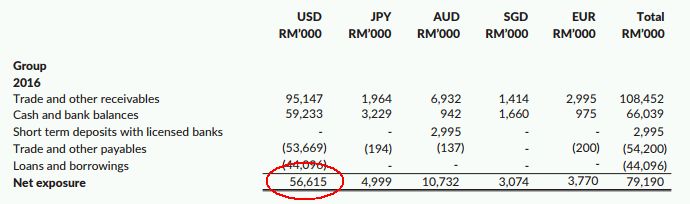
(3) & (4) is the average quarter rate of USD against RM. In Q1 2017, Dollar remain strong against Q4 2016. I check the annual report of which Thong Guan has RM 56.6 mil USD positive exposure as below as of 31 Dec 2016.
My thinking is: since Q1 2017 Dollar is strong (3), this should offer some cushion (forex gain) to the increase in resin price which will compress thong guan gross margin.
Unfortunately, Thong Guan registered net forex loss of RM -563k ( no. 7)
I suspect the forex loss is due to new rulling initiated by “洪金宝“。

I try do a calculation. Assuming the finalized direction was on immediate after 27th Dec 2016, then 75% of Thong Guan trade & receiveable amounted to RM 95.2 mil USD receiveable need to be converted immediately. The sum work out to be RM 95.2 mil x 75% = RM 71.4 mil worth of dollar need to be converted to RM. This left the sum of RM 23.8 mil of dollar worth trade receiveble.
The new rulling upside down the whole net positive exposure. It became net NEGATIVE EXPOSURE of RM (14.8 mil).
The strenghtening of USD in Q1 2017 of approximately 2.9% (no. 3) has caused Thong Guan to suffer forex loss of RM -429k. Thong reported a net forex loss of RM -563k (no.7). If adding up other currency exposure plus the time effect of 3 months, most likely will get very close number.
So, my 如意算盘pecah because of Mr hong.
(9) The good news is, we havequite a stable core earning trend.
Q2 2017: RM 15 mil (resin price stable)
Q1 2017: RM 14 mil (resin price stable)
Q4 2016: RM 14 mil (resin price stable)
Q3 2016: RM 10 mil (resin price fast rebound)
Q2 2016: RM 16.6 mil (resin price crash)
Q1 2016: RM 16.6 mil (resin price crash
Q4 2015: RM 16.5 mil (resin price crash)
Based on the stable trend of resin price for the past 3 quarters, I think the 2nd nano line will further increase the gross profit margin of Thong Guan.
Conclusion:
(1) The increase of PRODUCTION VOLUME + INCREASE Of GROSS PROFIT MARGIN from 2nd NANO line should improve the profitability of Thong Guan from Q3 2017 onward.
(2) The organic noodle contribution has not come in. Director inform that they are facing the labelling problem in China and goods are stuck at port. I hope this issue can be resolve soon.
Cheers,
YiStock
http://klse.i3investor.com/blogs/thongguan/130943.jsp
