I set up this blog to keep my studies on i3 for my own revision/discussion purposes, not buy/sell call
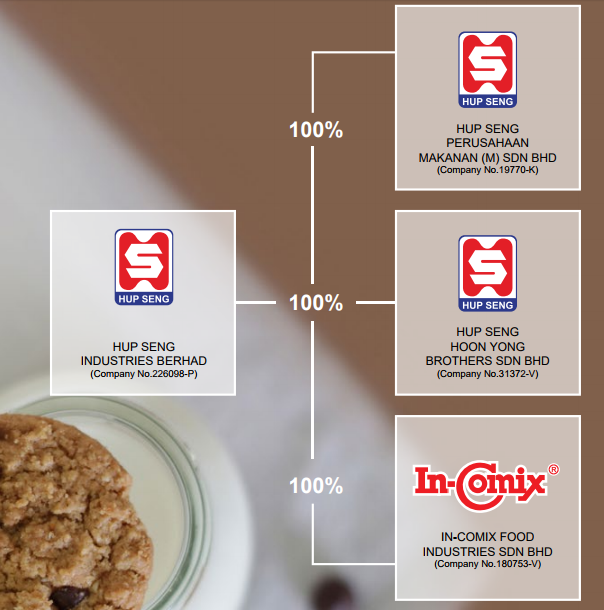
Hupseng Company Structure

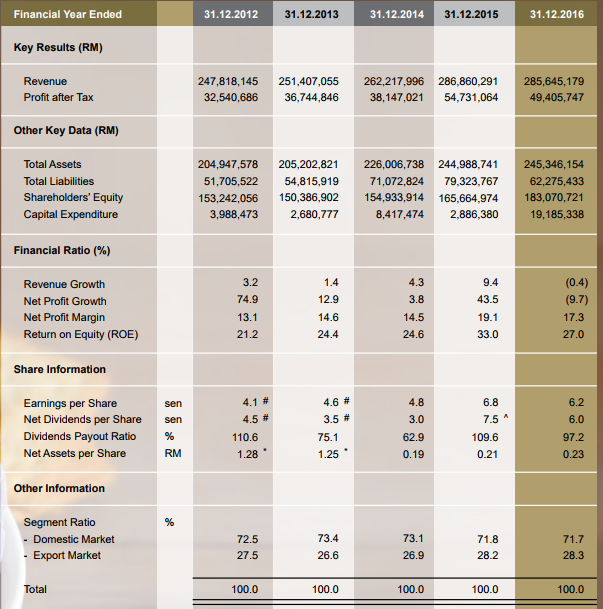
Extracted from AR2016
The products produced and distributed by the Group can be summarized into the following product ranges:
 OPEX
OPEX
1.Sales & Marketing
2.Distribution Channel (~9500 accounts)
FY2017
Key highlights
Reference:
Hupseng Company Structure
| Financials | |||||||||||
| 2007-12 | 2008-12 | 2009-12 | 2010-12 | 2011-12 | 2012-12 | 2013-12 | 2014-12 | 2015-12 | 2016-12 | TTM | |
| Revenue MYR Mil |
193
|
220
|
213
|
219
|
240
|
248
|
251
|
262
|
287
|
286
|
290
|
| Gross Margin % |
22.8
|
27
|
35
|
34.6
|
32.5
|
35.5
|
37.6
|
37
|
42.6
|
40.5
|
38.8
|
| Operating Income MYR Mil |
6
|
21
|
36
|
33
|
28
|
44
|
50
|
52
|
73
|
66
|
62
|
| Operating Margin % |
3.2
|
9.7
|
16.8
|
14.9
|
11.5
|
17.9
|
19.9
|
19.7
|
25.4
|
23.2
|
21.3
|
| Net Income MYR Mil |
5
|
16
|
27
|
23
|
19
|
33
|
37
|
38
|
55
|
49
|
46
|
| Earnings Per Share MYR |
0.01
|
0.02
|
0.03
|
0.03
|
0.02
|
0.04
|
0.05
|
0.05
|
0.07
|
0.06
|
0.06
|
| Dividends MYR |
0.01
|
0.01
|
0.01
|
0.02
|
0.02
|
0.03
|
0.04
|
0.02
|
0.04
|
0.04
|
0.04
|
| Payout Ratio % * |
126.5
|
37.3
|
89.3
|
82.3
|
82.3
|
81.1
|
100.4
|
17.2
|
76.9
|
64.8
|
69.4
|
| Shares Mil |
800
|
800
|
800
|
800
|
800
|
800
|
800
|
800
|
800
|
800
|
800
|
| Book Value Per Share * MYR |
0.14
|
0.16
|
0.18
|
0.18
|
0.18
|
0.19
|
0.18
|
0.19
|
0.21
|
0.21
|
0.21
|
| Operating Cash Flow MYR Mil |
7
|
15
|
32
|
31
|
33
|
39
|
41
|
47
|
58
|
49
|
63
|
| Cap Spending MYR Mil |
-8
|
-7
|
-2
|
-1
|
-6
|
-4
|
-3
|
-8
|
-3
|
-19
|
-20
|
| Free Cash Flow MYR Mil |
0
|
8
|
30
|
29
|
27
|
35
|
39
|
38
|
55
|
30
|
43
|
| Free Cash Flow Per Share * MYR |
0.01
|
0.01
|
0.04
|
0.04
|
0.04
|
0.06
|
0.04
|
0.07
|
0.03
|
||
| Working Capital MYR Mil |
32
|
43
|
64
|
76
|
86
|
94
|
93
|
95
|
108
|
113
|
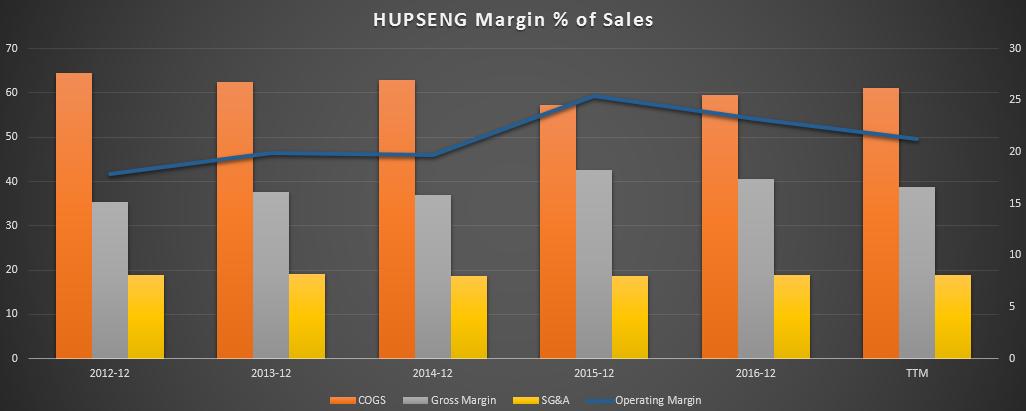
| Margins % of Sales | 2007-12 | 2008-12 | 2009-12 | 2010-12 | 2011-12 | 2012-12 | 2013-12 | 2014-12 | 2015-12 | 2016-12 | TTM |
| Revenue |
100
|
100
|
100
|
100
|
100
|
100
|
100
|
100
|
100
|
100
|
100
|
| COGS |
77.18
|
73
|
65.01
|
65.39
|
67.46
|
64.53
|
62.38
|
63.03
|
57.37
|
59.5
|
61.23
|
| Gross Margin |
22.82
|
27
|
34.99
|
34.61
|
32.54
|
35.47
|
37.62
|
36.97
|
42.63
|
40.5
|
38.77
|
| SG&A |
20.46
|
18.17
|
19.09
|
20.64
|
22.27
|
18.89
|
19.01
|
18.56
|
18.7
|
18.8
|
18.98
|
| R&D | |||||||||||
| Other | |||||||||||
| Operating Margin |
3.17
|
9.69
|
16.78
|
14.95
|
11.48
|
17.9
|
19.92
|
19.73
|
25.43
|
23.21
|
21.28
|
| Net Int Inc & Other | |||||||||||
| EBT Margin |
3.17
|
9.69
|
16.78
|
14.95
|
11.48
|
17.9
|
19.92
|
19.73
|
25.43
|
23.21
|
21.28
|
Extracted from AR2016
The products produced and distributed by the Group can be summarized into the following product ranges:
I.Biscuits: Crackers, cream sandwich biscuits, assorted biscuits, cookies and other series. (2/3 of revenue)
The biscuits produced by the Group are marketed under “Cap Ping Pong”
and “Hup Seng Cream Crackers” which are targeted towards the middle and
lower-end consumers whereas biscuits marketed under “Kerk” and
“Naturell” are premium modern products of the Group. The biscuits range
is further classified into 4 main categories, namely:
1. Crackers;
2. Cookies and others;
3. Cream Sandwich biscuits;
4. Assorted biscuits.
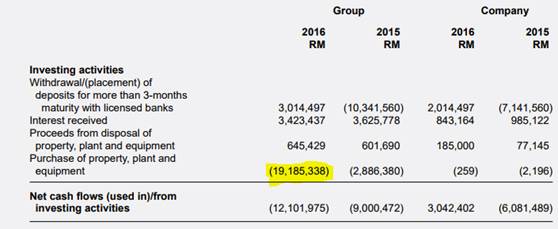
Capex:
- For the financial year ended 31 December 2016, the existing ovens at the Batu Pahat plant were operating on average of about 82% capacity utilization. The current capacity may not be able to cope with expected increase in demand in year 2017 and beyond. To overcome this, the Group had on 9 March 2016 entered into two conditional sale and purchase agreements to purchase two parcels of land and buildings adjacent to the existing factory. The purchase was completed on 6 September 2016.
- The Group has identified automation of certain production process and repackaging of selective products as some of the measures that will help in improving operational efficiencies. To improve packaging efficiency of our major products, “Hup Seng Cream Cracker” in the ensuing year, the Group plans to purchase an auto stacking system replacing current process which is laborious.
- In 2017, the Group plans to purchase a new production line to replace the existing old line with an expected commissioning in 2018. The new line with modern technology could also improve the flexibility and efficiency in the Group’s manufacturing process.
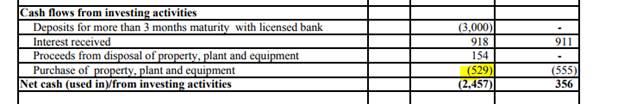
Capex 1Q2017
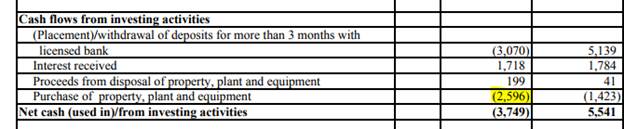
Capex 2Q2017
II.Beverages: Instant beverages mix. (~5% of revenue)
The Beverages range, on the other hand, is marketed under “In-Comix”
and is categorized under (3) three main categories, namely Instant
Coffeemix, Instant Teas and Nutritious Instant Cereal.
III.Other agents’ products (Trading): Rice crackers and others.
In addition to distributing biscuits and beverages, the Group is also
the distributor for other agent products, such as, “Wang Wang” rice
crackers; “Ong Sam Yong” chinese tea, and other snacks products.
1.Sales & Marketing
- Sustain the existing market share by stepping up promotional activities like sampling, increased block/shelf displays at strategic positions and crowded locations.
- For the coming year (2017), the Group has drawn up programs for promotional activities starting off with saleable and premium products. More emphasise will be given on sampling activities to create product awareness and to increase block/shelf displays.
- The main focus for the Group is on the coverage of all various retails sales point across the wholesale, retail and modern distribution channels. These sales points can range from mom and pop outlets, to convenience stores, 24-hours stores and various super-and hypermarket.
2.Distribution Channel (~9500 accounts)
a.Retail - buy goods directly from producers and sell them to the consumers
Group’s sales team reach out to retailers and door step delivery is
done mostly by own transportation fleets, which is itself serves as a
mobile advertising to the Group. When visiting retailers, they stay
up-to-date on the changing needs of customers via interactive discussion
with the retailers. They help retailers arrange promotion programs, get
closer to consumers and testing out new products and markets.
b.Wholesale - classic distribution
method whereby products are sold in bulk to a major wholesaler who in
turn sells to various resellers further down the retail chain
Resellers not covered by the Group due to remoteness and geographical reasons.
c.Modern Channels - distribution
model consisting of products being directly retailed at major
supermarket or hypermarket chain stores and other convenience stores.
Products are typically ordered via a centralized purchasing system and
delivered to either a distribution center or to the individual outlets.
This channel is often seen in urban population centers with high
density.
3.Export Market (~28% of revenue)
More than 40 Countries
Top 5 exported countries (~2/3 of export revenue):
-
Indonesia
-
Singapore
-
Myanmar
-
Thailand
-
Saudi Arabia
The Group has managed to sustain its export revenue helped out by the
up and coming markets, onwards due to the acceptability of new packaging
specifications and taste by the markets.
Target: Increase export sales >10 mil in 4 years
Group to draw more orders for the existing export distributors
To address potential risk of earnings erosion from domestic market, the Group is looking into .
FY2017
Q1 2017
Export sales grew strongly by 18% propelled by higher demand mainly from Asia region
Q2 2017
Strong export sales which grew by 23%
20% growth in export sales or RM7 million propelled by higher demand
from existing distributors due to concerted effort of promotion
activities as well as contribution from a new distributor in China whom
the Group nurtured since 2016.
Key highlights
- Brand recognition is picking up in China from all the marketing & distribution strategies, as well as Japan
- Reaping the fruits from the CAPEX from 2016-2018 (expansion to meet growing demands & automation for auto-stacking)
- Net Cash, which gives HUPSENG the advantages to invest more for CAPEX and OPEX (marketing & distribution) despite all the anti-profiteering issues plus rising raw material cost as well as softening Domestic Market
- Dividend Yield around 5%, seemingly sustainable barring any unforeseen circumstances
- FCPO price seem to be hitting the ceiling, expecting the price to come down 2H2017 with all the negative sentiment revolving around FCPO as well, thus COGS expected to reduce
- Beverages segment still trying to set a foothold in the market, not contributing much in the percentage of Revenue, but has good synergy with Biscuit segment.
Reference:
- Morningstar
- Annual Report 2016
- QR Q1 2017
- QR Q2 2017

http://klse.i3investor.com/servlets/stk/5024.jsp
