Exactly 3 months ago, I had written an article to predict Hengyuan’s Q2 EPS, refer below:
http://klse.i3investor.com/blogs/Insight1/129795.jsp
The actual reported earning was somewhat close, though the basis used to predict did not exactly tally with some information mentioned in HY Q2 financial report. Thus, I had made an amendment to my current derivation on Q3 EPS accordingly. The change is purely on the inventory valuation where according to my judgement they are hedging about 50% of its value. This way, my estimation would be way more conservative too as I am basically reducing the gains by half for Q3.
I am writing this article again to continuously educate i3 member to have an idea of how the refinery business works, so that they can appreciate HY's full potential valuation, while not getting spooked (deterred) by its short-term volatility by simply patiently seeing the inventory effects on longer-term (6 months). This way perhaps we could have avoided the dip on price we saw after Q2 results on 28 August where 11 Million shares changed hand from poorly informed investors to the intelligent ones.
This article on its EPS prediction is something the writer does for fun and as such do not place in all your eggs on these baskets (or remove, or transfer your eggs) simply because the article suggests so – always use your own judgements.
Now let the fun part of numbers begin..
For any refinery, there are two independent factors that contribute to its quarterly earnings, one is the Refining Margin (1) and the other is the Inventory gain/loss (2) due to crude oil price changes between the reporting period.
Earnings factor (1): the refining margin
This is called the profit due to CCS Margin.
(A) CCS Profit = Refining Throughput, T (Barrels/day) x No. of days in operation (Days) x Refining CCS Margin (USD/Brl) x Exchange rate (RM/USD)
Using a realistic estimate of the expected Q3 average refining margin of 10USD/brl, HRC CCS profit is as per below:
= 112k bpd x 90 days x 10 USD/brl x 4.2 RM/USD
= 423 M
One can refer to the below chart on the 10USD/brl justifcation:
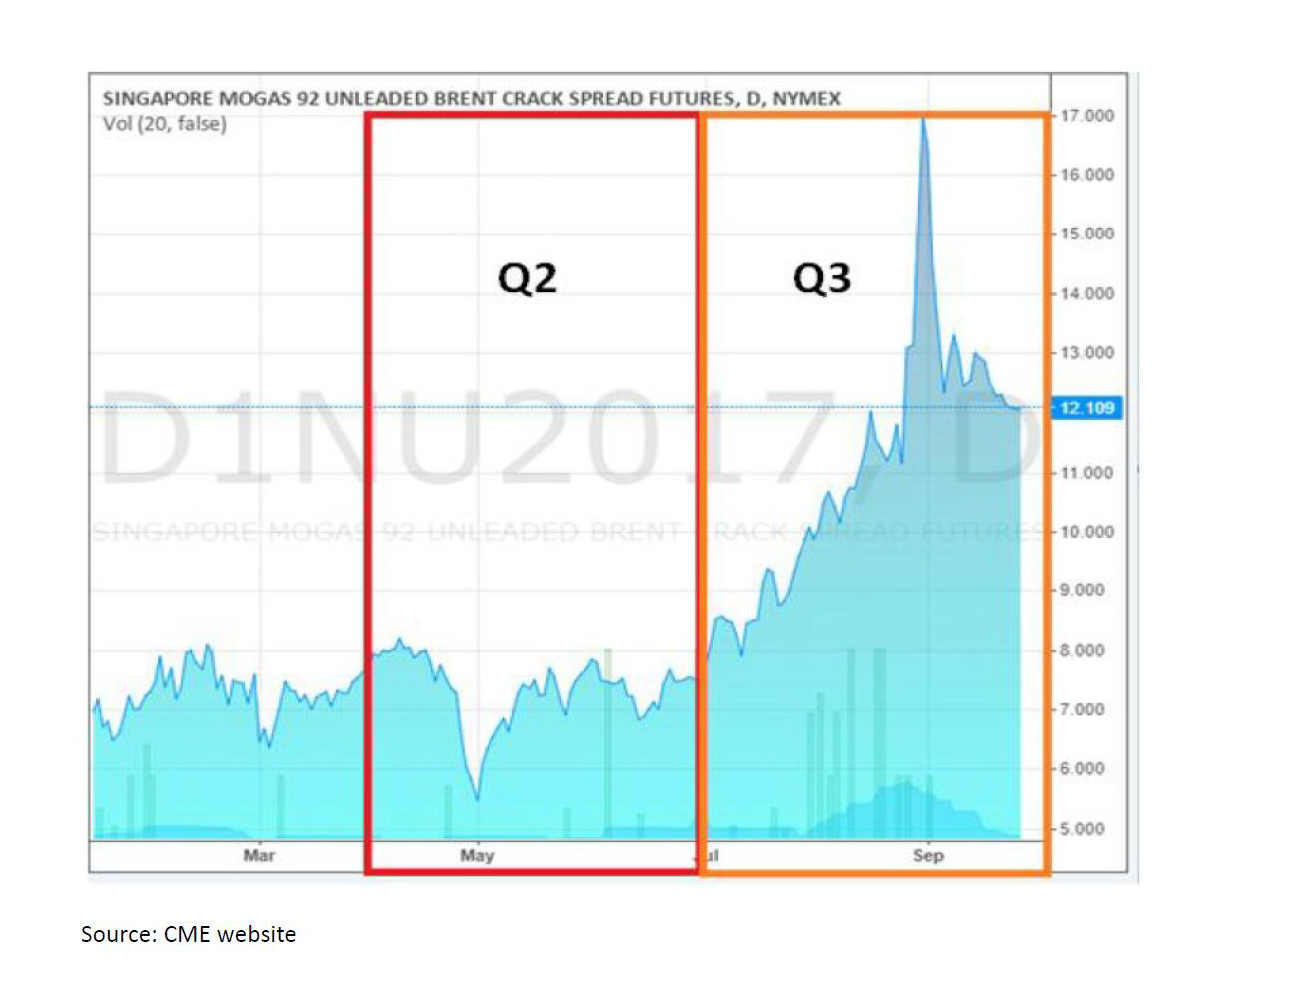
Note that, I am unable to show the crack spread for Gasoil (Diesel) which combined with Gasoline (Petrol) yields more than 95% of HY refined products, however the 10USD/brl average I am using is rather conservative considering some of the peak in crack spread caused by Hurricane Harvey and consistently higher than 11USD/brl crack spread on certain months during this qtr for Diesel.
Earnings factor (2): Inventory gain / loss,
This is simply the valuation of their Inventory (consisting of both product and feed crude) as per the market valuation at end of the reporting period.
The oil price used by the company during the reporting period is quite dependent on the date they chose as a reference, we may only use the Brent closing price on the last week of the month as an approximate indicator.
As such taking a conservative approach, I estimate that Brent price of ~ 56 USD/brl to represent ending value for Sept17 and 47 USD/brl to represent starting value as of end June17. The difference is 9 USD/brl.
Due to 50% hedging on its inventory assumption, we only consider 50% of the inventory affected by the Brent price change. Thus, 4700 barrels inventory (used originally as per my article 3 months ago) is now reduced by half to 2350 barrels.
(B) The inventory Gain = Ending Value of inventory (Sept 17) – Starting Value of Inventory (Jun 17)
Starting Value of Inventory (June17) = Inventory (barrels) x Starting Price of Brent (USD/barrel)
= 2350k barrels x USD 47/brl
= 110M
Ending Value of Inventory (Sept17) = Inventory (barrels) x Ending Price of Brent (USD/barrel)
= 2350k barrels x USD 56/brl
= 131M
Thus, the inventory gain is
= 131M – 110M
= 21M USD
= 88M RM
The Total Effect, Is the FIFO profit which will be the reported Gross profit is simply the addition of the CCS Profit with Inventory gain/loss.
Refineries divide the FIFO profit by the barrels processed to obtain FIFO refining margins.
Thus, the FIFO Profit (GROSS PROFIT):
= CCS Profit + Stock gain/loss
= 423M + 88 M
= 511 M
Taking Hengyuan's Sales & Admin overhead costs, Other expenses and Finance costs which comes to approximately 120M, the Net profit would be:
= 511M – 120M
= 391 M (this results with a staggering EPS of 130 cents for Q3 2017 for HENGYUAN assuming no tax as per previous qtr).
Unlike HY, for PETRONM, i am unable to find a good derivation method for my prediction. I had based on the exclusion method presented on the Table below (which is self-explanatory using some basis on Bataan refinery shutdown conservatively).
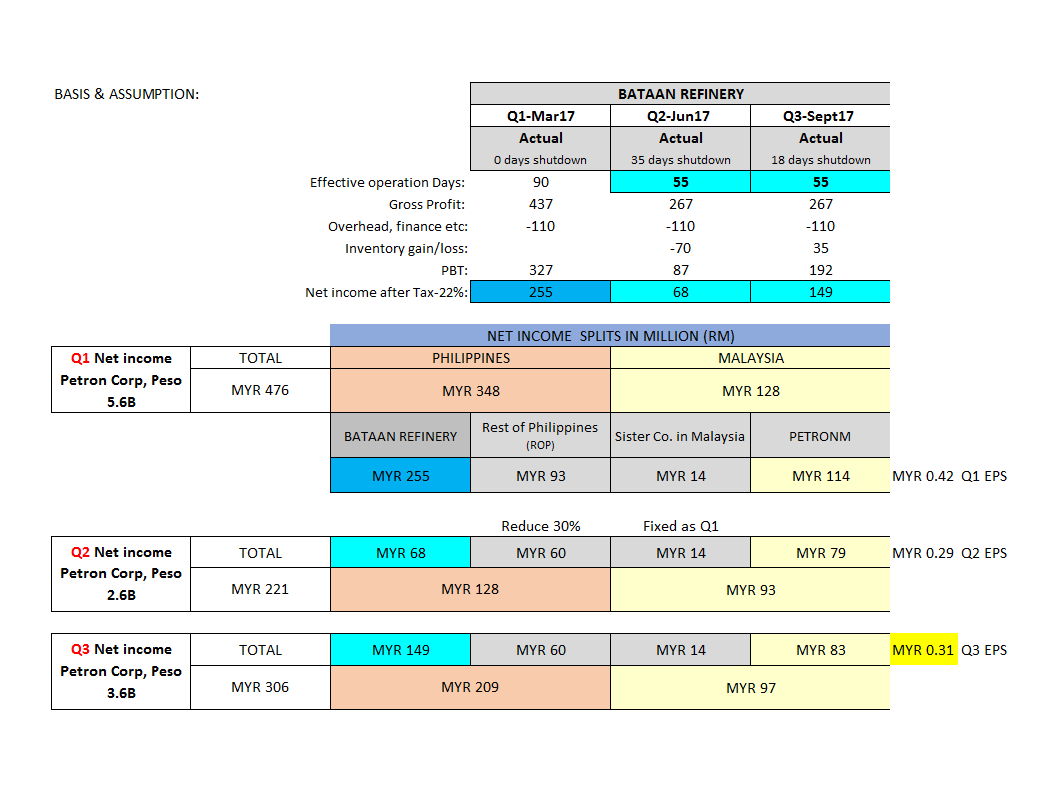
The table basically expresses the fact that in all-likelihood PetronM is unlikely to deliver a spectacular EPS inline with Hengyuan (say exceeding 50 cents) as some may be expecting (market expectations). However, its current price of ~ RM 13 is still cheap for a recurring quarterly EPS of 30 cents. This is probably due to interruption on PetronM supplies (outsourcing) caused by the shutdown of Bataan refinery which had carried over to Q3.

http://klse.i3investor.com/blogs/Insight1/137875.jsp
