Rebar price (updated to 9 Feb)
Before we estimate possible profit margin of Masteel in Q1 2018, let us see rebar price chart from 2nd half of 2017 up to 9 Feb 2018 from MITI weekly bulletin as below:
The average Q4 (Oct, Nov, Dec) steel bar price is around RM2480 based on MITI price. More interestingly, the average steel bar price from Jan to 9 Feb 2018 price is RM2725. This price indicates an increment of 9.9% over Q4’17.
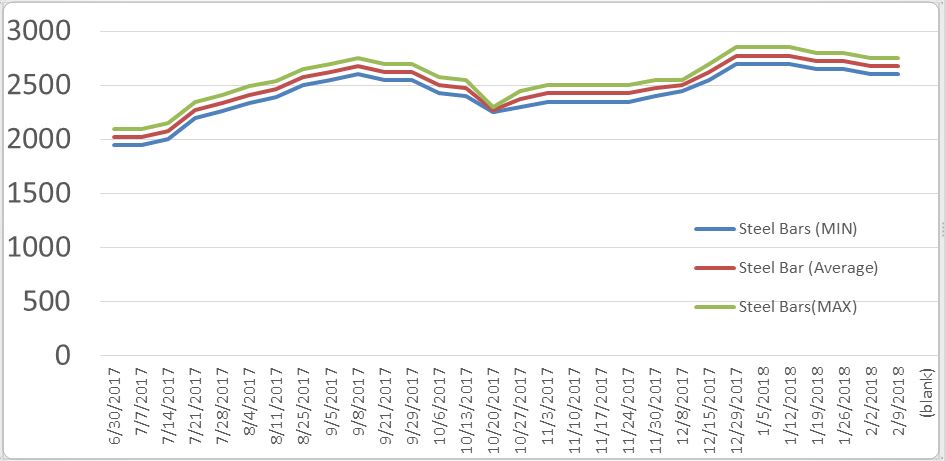
Source: MITI_Weekly_Bulletin (July, Aug, Sept, Oct, Nov, Dec, Jan, Feb)
What I wish to show you is when ASP (average selling price) of rebar is increased, the profit margin of Masteel will be expanded as they have high inventory level and strong demand of their products (Masteel’s selling price is slightly lower than their peers).
Let us have a look on Masteel raw material (scrap iron) as below:

Source: Source: MITI_Weekly_Bulletin
What I can observe is the rebar ASP increment is higher than the scrap iron price increment. Thus, the profit margin of Masteel should be expanded (Ssteel has shown profit margin improvement in their latest report).
To estimate profit of Masteel in Q4’17, let us go through the ASP price in Q4 as compared to Q3 as in the table below:
Let us calculate the possible profit Q4’2017 table below:
NP = 401M X 0.07 = RM28.01 mil
Masteel did not pay income tax in the last quarter (Q3) due to tax credit. I assume Q4 it may need to pay income tax and let assume it is about 20% (past 3 quarters Masteel pay lower tax rate).
Estimated net profit after tax = RM22.4 mil. RM22.4 mil profit translated to EPS of 5.25 sen (after bonus issue dilution) . Personally I estimate Masteel may not include the bonus share in their coming Q4’17 result calculation as their bonus shares just listed on Bursa on 14 Feb but they might finalize their Q4 result in Jan 2018 (if not include bonus share, then EPS will be 6.99 sen for 22.4 mil profir)
2016 and 2017 Quarter Profit Comparison (before and after bonus and private placement dilution)
The demands and domestic consumption of steel bar and billets in Q4’17
should be sustainable due to a pick-up in the construction of mega
projects (MRT2, LRT3, Tun Razak Exchange building, Pan Borneo Highway
Sarawak, and ECRL).
The estimated diluted EPS for FY2017 is about 20.07 sen (16.62 sen) which translated to PE of around 6.9 (8.3 if stripped off one-off tax gain) based on current price of RM1.38. The fair forward 12-month PEx is 9.0-10.0 (fair price of RM1.82 and RM2.02) which indicate an upside of 31.8%-46%. The next section I will explain why PE 10 is acceptable for Masteel due to its attractive PEG ratio (G stand for growth).
Price/Earnings to Growth (PEG) ratio
The price/earnings to growth ratio (PEG ratio) is a stock's price-to-earnings (P/E) ratio divided by the growth rate of its earnings for a specified time period. The PEG ratio is used to determine a stock's value while taking the company's earnings growth into account, and is considered to provide a more complete picture than the P/E ratio.
The PEG ratio formula for a company is as follows:
PEG Ratio = Price-to-Earnings (PE) / Annual Earnings Per Share Growth
Based on the higher (9.9%) ASP price in Jan-Feb 2018, the estimated EPS growth rate for Masteel could be in the range of 22% - 32%. Let assume 22% of growth rate EPS in 2018 to calculate Masteel PEG as table below:
A rule of thumb is that any PEG ratio below 1.0 is considered to be a
good value. Masteel current valuation still consider cheap based on its
forward PE ratio and future growth rate.
The PEG ratio of 0.49 indicates that it is still undervalue relative to its growth potential.
If Masteel can achieve 22% growth rate in 2018 EPS (due to high average selling price of rebar), the fair PEx is in the range 9 to 10 which translated to RM1.82 and RM2.02 target price.
Risk

Before we estimate possible profit margin of Masteel in Q1 2018, let us see rebar price chart from 2nd half of 2017 up to 9 Feb 2018 from MITI weekly bulletin as below:
The average Q4 (Oct, Nov, Dec) steel bar price is around RM2480 based on MITI price. More interestingly, the average steel bar price from Jan to 9 Feb 2018 price is RM2725. This price indicates an increment of 9.9% over Q4’17.
Source: MITI_Weekly_Bulletin (July, Aug, Sept, Oct, Nov, Dec, Jan, Feb)
What I wish to show you is when ASP (average selling price) of rebar is increased, the profit margin of Masteel will be expanded as they have high inventory level and strong demand of their products (Masteel’s selling price is slightly lower than their peers).
Let us have a look on Masteel raw material (scrap iron) as below:
Source: Source: MITI_Weekly_Bulletin
What I can observe is the rebar ASP increment is higher than the scrap iron price increment. Thus, the profit margin of Masteel should be expanded (Ssteel has shown profit margin improvement in their latest report).
To estimate profit of Masteel in Q4’17, let us go through the ASP price in Q4 as compared to Q3 as in the table below:
|
2017 |
ASP per ton (RM) |
QoQ comparison |
|
ASP |
Q3 = 2350 Q4 = 2480 |
Increase by RM130 if compared Q4 vs Q3 --> Increment of 5.5% in Q4 vs Q3. Scrap iron increasing also in Q4 but ASP increment is higher than scrap iron increment |
|
Q4 |
Q4 = 2480 NP = 28.1mil |
Net profit margin % in Q3 = 6% Let assume higher net profit margin of 7% in Q4 and same revenue as per Q3 of about 401mil. |
Masteel did not pay income tax in the last quarter (Q3) due to tax credit. I assume Q4 it may need to pay income tax and let assume it is about 20% (past 3 quarters Masteel pay lower tax rate).
Estimated net profit after tax = RM22.4 mil. RM22.4 mil profit translated to EPS of 5.25 sen (after bonus issue dilution) . Personally I estimate Masteel may not include the bonus share in their coming Q4’17 result calculation as their bonus shares just listed on Bursa on 14 Feb but they might finalize their Q4 result in Jan 2018 (if not include bonus share, then EPS will be 6.99 sen for 22.4 mil profir)
2016 and 2017 Quarter Profit Comparison (before and after bonus and private placement dilution)
|
|
2017 (mil, EPS in sen) excluded dilution of bonus & private placement
|
2017 (mil, EPS in sen) Included dilution of bonus & private placement
|
2016 (mil, EPS in sen)
|
|
Q1 |
14.08, 5.83
|
14.08, 3.29
|
5.0, 2.1
|
|
Q2 |
10.6, 4.38
|
10.6, 2.48
|
10.68, 4.41
|
|
Q3(one-off gain) |
38.67, 12.88sen (23.9, 7.58)
|
38.67, 9.05sen (23.9, 5.6)
|
1.2, 0.51
|
|
Q4 |
?? estimated about 22.4, 6.99 sen
|
?? estimated about 22.4, 5.25 sen
|
4.03, 1.67
|
|
Total |
Estimated(~85.75, 71.07, ~28.34 sen, ~24.78 sen (strip off one-time gain)
|
Estimated(~85.75, 71.07, ~20.07sen, ~16.62 sen (strip off one-time gain
|
21.03, 8.69
|
The estimated diluted EPS for FY2017 is about 20.07 sen (16.62 sen) which translated to PE of around 6.9 (8.3 if stripped off one-off tax gain) based on current price of RM1.38. The fair forward 12-month PEx is 9.0-10.0 (fair price of RM1.82 and RM2.02) which indicate an upside of 31.8%-46%. The next section I will explain why PE 10 is acceptable for Masteel due to its attractive PEG ratio (G stand for growth).
Price/Earnings to Growth (PEG) ratio
The price/earnings to growth ratio (PEG ratio) is a stock's price-to-earnings (P/E) ratio divided by the growth rate of its earnings for a specified time period. The PEG ratio is used to determine a stock's value while taking the company's earnings growth into account, and is considered to provide a more complete picture than the P/E ratio.
The PEG ratio formula for a company is as follows:
PEG Ratio = Price-to-Earnings (PE) / Annual Earnings Per Share Growth
Based on the higher (9.9%) ASP price in Jan-Feb 2018, the estimated EPS growth rate for Masteel could be in the range of 22% - 32%. Let assume 22% of growth rate EPS in 2018 to calculate Masteel PEG as table below:
|
|
2018E (estimated) |
2018E |
|
PE |
9 |
10 |
|
Growth |
22% (estimated) |
22% (estimated) |
|
EPS |
20.27 sen |
20.27 sen |
|
PEG |
0.409 |
0.455 |
The PEG ratio of 0.49 indicates that it is still undervalue relative to its growth potential.
|
|
2018E |
2018E |
|
PE |
9 |
10 |
|
EPS (22% growth) |
20.27 sen |
20.27 sen |
|
Fair Price |
RM1.82 |
RM2.02 |
Risk
- Higher scrap iron price locally and internationally which may affect their cost per ton
- Higher Graphite Electrode price which may affect their production cost.
- Unplanned break down of their machines which affect their utilization rate of their production capacity.
- Higher transportation cost due to rising fuel cost in Malaysia in recent two months. Masteel factory is located in Bukit Raja which is closer to LRT project which provides some advantage to its transportation cost as compared to its Peers.
- Average selling price (ASP) has increased to RM2480 in Q4’17 and currently the price even higher in Q1 of 2018 (around RM2725 per ton for the past 1.5 month). If this price can be sustained, Masteel is likely to have EPS growth of 22% to 32% in 2018.
- The higher ASP in Q4 may produce higher profit (RM22.4 mil or diluted EPS of 5.25 sen) in Q4 for Masteel. Based on current price of RM1.38. There fair forward 12-month PEx is 9-10 (with estimated 22% growth rate in EPS) which indicates an upside of 31.46% (target price of RM1.82-RM2.02).
- Masteel has relatively high inventory (RM445mil) level and this lead this better opportunity to reap profit in high rebar price in Q4 of 2017 and in 2018.
- RMUSD rate appreciation (3.91 now) in Feb 2018 which implies that Masteel stands to has lower import cost for their raw materials. In fact, the rate of RM has appreciated around 10% (from early Q3 rate of 4.3 to 3.93). This drop make contributes higher profit due to lower material import cost.
- There should be some forex gain due to lower payable amount in Masteel’s USD denominated loan.
If you interested on my future analysis reports, please contact me at davidlimtsi3@gmail.com

You can get my latest update on share analysis at Telegram Channel ==> https://t.me/davidshare
Disclaimer:
This writing is based on my own assumptions and estimations. It is
strictly for sharing purpose, not a buy or sell call of the company.
http://klse.i3investor.com/blogs/david_masteel/148242.jsp
