Author: YiStock | Publish date: Thu, 31 May 2018, 06:35 PM

Pentamaster has released 2 sets of Q1 2018 Quarterly Report on 22 May 2018. One set for PCB & one set for PIL.
Both set of account has many similarity simply because 63.1% of PIL is owned by PCB. By comparing 2 set of results, i tried to do an earning FORECAST for full year 2018. At the same time trying to clear the quastion of RM 7.146 mil listing expenses is actually prepaid by PCB only. (Please note that an earning forecast is near similar to weather forecast. It will never be 100% accurate. It certan cases, the accuracy is Zero)
PCB PIL PCB
Q1 2018 Q4 2017 Q3 2017 Q2 2017 Q1 2017 Revenue 99,383 98,048 98,504 83,302 54,811 47,572
Cost of Goods Sold 69,886 68,515 69,159 62,622 37,215 34,557
Gross Profit (a) 29,497 29,533 29,345 20,680 17,596 13,015
% gross margin 29.68% 30.12% 29.79% 24.83% 32.10% 27.36%
Other Income 5,955 5,951 4,405 212 426 419
Incl. Forex gain 5,454 5,454 363 71 237 17
adjustment (b) 501 497 4,042 141 189 402
Admin Expenses (c) 18,708 12,553 18,434 9,665 5,028 3,229
Incl. Listing Expenses 7,146 1,647 1,062 4,140 0 0
incl. One-off amortisation proj. Man + GEMs 0 0 4,522 0 0 0
Incl. Forex loss 4,792 3,926 5,959 920 1,260 0
adjustment (c) 6,770 6,980 6,891 4,605 3,768 3,229
% core admin expenses 6.81% 7.12% 7.00% 5.53% 6.87% 6.79%
Reported PBT 16,448 22,645 13,458 9,415 11,768 9,341
tax 1,434 1,434 1,498 1,014 1,452 846
Reported PAT 15,054 21,211 11,960 8,401 10,316 8,495
Adjusted Core PAT (add back special item & net forex exposure ) 21,538 21,330
18,735 13,390 11,339 8,478
% net profit margin 21.6% 21.7% 19.0% 16.1% 20.6% 17.8%
Reported PAT (owner of the company) 7,227
Core earning @ 63.1% (approximately) 14,024 (14% margin)
Interpretation:
1) based on above quarters report, we can see that "Admin Expenses" after excluding Listing Expenses, Forex Loss & One off expenses, the percentage is around 6.7% (average 6 quarters). It is the Listing exercise that mess up the admin expenses. Since the listing activity is completed, i expect admin expenses should back to normal.
2) Foreign currency hedging were conducted perfectly all the while except for Q4 2017. Reason can be found in Q4 quarter report.
3) Listing fee for PIL (RM1.647 mil) and PCB (RM7.146 mil) has been reported separately in Q1 2018. This is the reason causing the Admin Expenses amount reported differently in PCB (RM 18.708 mil) and PIL (RM 12.553 mil) quarter report. Therefore, the listing fee showed in PCB report amounted to RM 7.146 is supposed to be wholly paid by PCB.
4) Total Listing expenses paid so far is RM 14 mil (instead of RM 15 mil). Question remain if such amount paid by PCB will eventually be claimed back from PIL. Any claim should add back to future PCB's net profit. Refer HERE.
5) Adding back the listing fee into PCB's portion of earning (owner of the company (63.1%), Profit will be around RM 14 mil for Q1 2018 for PCB only.
6) PCB order book stood at RM 315 mil as of end of Q1 2018 and all machines supposed to be delivered to end customer in coming 3 to 4 quarters.
7) The Most Optimistic case:
FY 2018 total Revenue RM 400 mil; @ 19% net margin (average 6 quarters) = RM 76 mil net profit for PCB & PIL. Apply bluntly 63.1% = RM 48 mil @ EPS 15 sen per share for PCB only
PCB historical PE is at the normal range of (20 to 30) from Aug 2017 to May 2018. Refer below:
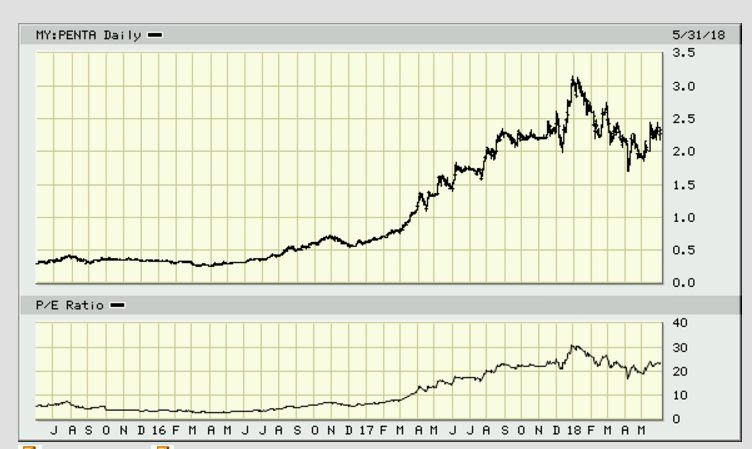
By applying BLUNTLY PE 25,
TP for penta: 25 PER x 15 sen = RM 3.75 per share, representing upside potential of 60% from today closing price of RM 2.33
Should Penta Order Book continue to increase as per my article here, i shall review this TP again.
Cheers,
YiStock
Note: This is the most optimistic case. If you buy blindly without own research, you most likely ended up in shark's stomach. Good Luck!
