When I began my journey to learn technical analysis, the relative
strength index (RSI) was one of the first indicators I picked up. The
reason was simply that everyone was talking about it and I can easily
obtain the information on the internet. At one time, I was so naïve that
I thought RSI is one of the most important indicators and it is a
“must-have” indicator for stock charting. I even assumed that I can
easily make money by following the RSI line that bounces between the two
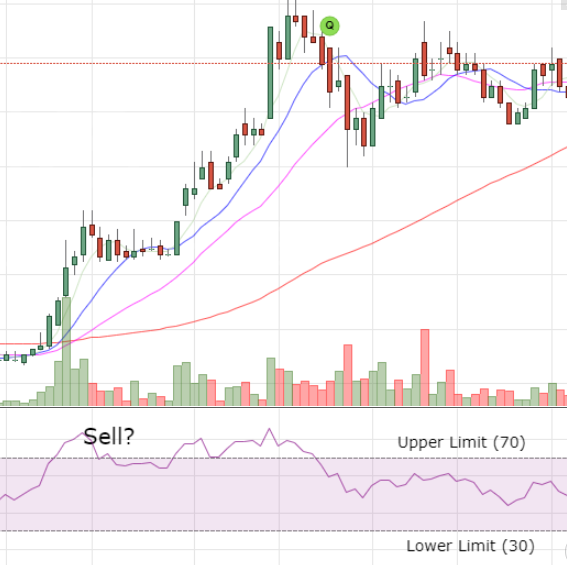
lines of limit. The typical two lines of limits are 1) lower limit (30)
or oversold, and 2) upper limit (70) or overbought. The idea is to buy
when it touches the lower limit (30) and sell when it touches the upper
limit (70). The above picture illustrates the buy/sell timing using the
RSI line.
During my learning curve, a question popped up in my mind, “If
this indicator can make money easily, the person who knew would have exploited
it for own advantages. Why would he/she choose to share this precious information?”
This question prompted me to think that RSI is not the ultimate solution and technical
analysis can’t be so easy. I believe there is no easy way of making money in the
stock market. Hence, I decided to conduct a study and I noticed this indicator
is risky if you are not cautious. It can misguide you to buy at the wrong trend
or sell too early. Let’s examine the examples below. Example 1:
On the day RSI touches the lower limit (30), it should be a buy for
RSI users. However, the Doji breaks the support line and shows a bearish
signal. This is not a spring
candle due to the low volume. Additionally, the candle on the prior 7
days indicates there is a supply and imminent climatic selling is on the
way. The RSI line continues to travel below the lower limit (30) as the
climatic sell persists. Example 2:
The RSI line tested the lower limit (30) twice as the price
continues to plummet. Although the RSI line goes up in between the two tests,
the price makes little progress due to a lack of demands. After the third test, the climatic sells
continue after the RSI bounces from the lower limit. The stock drops 89% eventually. Example 3:
The price continues to skyrocket after the RSI line touches the
overbought limit (70). RSI users would have sold it early thinking it is
overbought. They will not buy back even though the stock begins the
second stage rally because the RSI line is still travelling at the
overbought limit (70). This stock goes up 135% eventually. Example 4:
The RSI line goes up together with the first rally attempt,
then it consolidates at the overbought limit (70) and does not come back to
oversold limit (30). This stock goes up another 39% during the RSI
consolidation, the total gain is 79% in one month period. If the RSI users sell
thinking it is overbought, he/she will miss this handsome opportunity. Conclusion
RSI can be used to check the current strength of a stock
price but not buy/sell. The term oversold and overbought are overly endorsed by
some traders, they claim this is an indication of buy/sell. To buy/sell, you
need other analysis and rules to guide you. Personally, I do not use RSI for my
charting. Too many indicators will give me the wrong impressions of the current
trend. I prefer to keep it simple, fast and accurate for my charting.
 When I began my journey to learn technical analysis, the relative
strength index (RSI) was one of the first indicators I picked up. The
reason was simply that everyone was talking about it and I can easily
obtain the information on the internet. At one time, I was so naïve that
I thought RSI is one of the most important indicators and it is a
“must-have” indicator for stock charting. I even assumed that I can
easily make money by following the RSI line that bounces between the two
lines of limit. The typical two lines of limits are 1) lower limit (30)
or oversold, and 2) upper limit (70) or overbought. The idea is to buy
when it touches the lower limit (30) and sell when it touches the upper
limit (70). The above picture illustrates the buy/sell timing using the
RSI line.
When I began my journey to learn technical analysis, the relative
strength index (RSI) was one of the first indicators I picked up. The
reason was simply that everyone was talking about it and I can easily
obtain the information on the internet. At one time, I was so naïve that
I thought RSI is one of the most important indicators and it is a
“must-have” indicator for stock charting. I even assumed that I can
easily make money by following the RSI line that bounces between the two
lines of limit. The typical two lines of limits are 1) lower limit (30)
or oversold, and 2) upper limit (70) or overbought. The idea is to buy
when it touches the lower limit (30) and sell when it touches the upper
limit (70). The above picture illustrates the buy/sell timing using the
RSI line.