HIBISCS (5199) Hibiscus Petroleum Berhad (5199.KL) - Value Investing Equity Research Report
(This article was written on 5 April 2020)
Download PDF of this article here: https://docdro.id/oxRgeM1
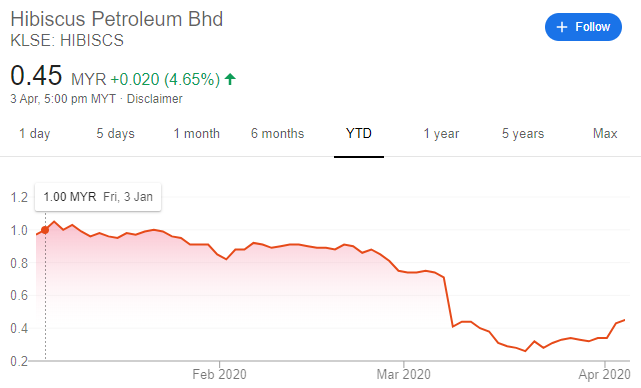
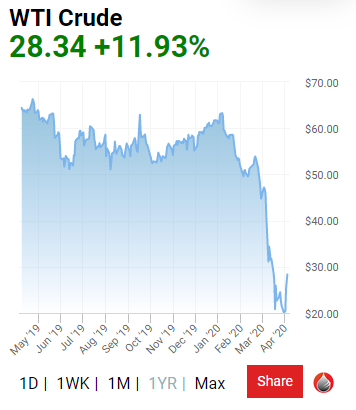
In light of the recent fall in oil prices due to the Saudi-Russian dispute and dampening demand for oil due to the lockdowns implemented globally, O&G stocks have taken a severe beating, falling approximately 50% from their highs at the beginning of the year. Not spared from this onslaught is Hibiscus Petroleum Berhad (Hibiscus), a listed oil and gas (O&G) exploration and production (E&P) company.
Why invest in O&G stocks in this particularly uncertain period? For one, valuations of these stocks have fallen to multi-year lows, bringing the potential ROI on these stocks to attractive levels. Oil prices are cyclical, and are bound to return to the mean given a sufficiently long time horizon. The trick is to find those companies who can survive through this downturn and emerge into “normal” profitability once oil prices rebound.
In this article, I will explore the upsides and downsides of investing in Hibiscus. I will do my best to cater this report to newcomers to the O&G industry – rather than address exclusively experts and veterans of the O&G sector. As an equity analyst, I aim to provide a view on the company primarily, and will generally refrain from providing macro views on oil or opinions about secular trends of the sector. I hope you enjoy reading it!
Stock code: 5199.KL
Stock name: Hibiscus Petroleum Berhad
Financial information and financial reports: https://www.malaysiastock.biz/Corporate-Infomation.aspx?securityCode=5199
Company website: https://www.hibiscuspetroleum.com/
While the company is domiciled in Malaysia, its two main oil producing fields are located in both Malaysia and the UK. The Malaysian oil field is commonly referred to as the North Sabah field, while the UK oil field is commonly referred to as the Anasuria oil field. Hibiscus has licenses to other oil fields in different parts of the world, notably the Marigold/Sunflower oil fields in the UK and the VIC cluster in Australia, but its revenues and profits mainly stem from the former two oil producing fields.
Given that it’s a small player and has only two primary producing oil fields, it’s not surprising that Hibiscus sells its oil to a concentrated pool of customers, with 2 of them representing 80% of its revenues (i.e. Petronas and BP). Fortunately, both these customers are oil supermajors, and are unlikely to default on their obligations despite low oil prices.
At RM 0.45 per share, the market capitalization is RM 714.7m and it has a trailing PE ratio of about 5x. It doesn’t carry any debt, and it hasn’t paid a dividend in its listing history. The MD, Mr. Kenneth Gerard Pereira, owns about 10% of the company’s outstanding shares.
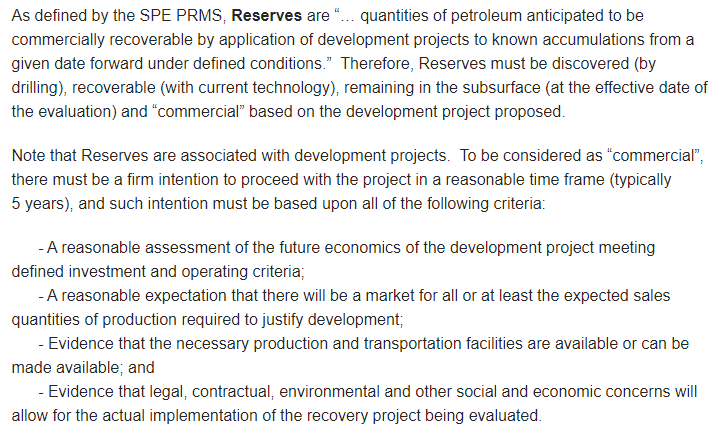
In general, there are three types of categories for a company’s recoverable oil volumes – Reserves, Contingent Resources and Prospective Resources. Reserves are those oil fields which are “commercial”, which is defined as below:
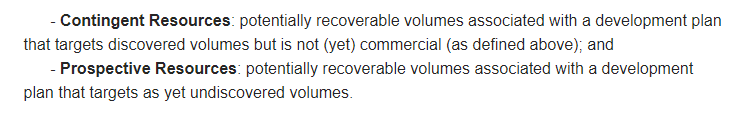
Contingent Resources and Prospective Resources are further defined as below:
In the industry lingo, we generally refer to Reserves as ‘P’ and Contingent Resources as ‘C’. These ‘P’ and ‘C’ resources can be further categorized into 1P/2P/3P resources and 1C/2C/3C resources, each referring to a low/medium/high estimate of the company’s potential recoverable oil volumes:
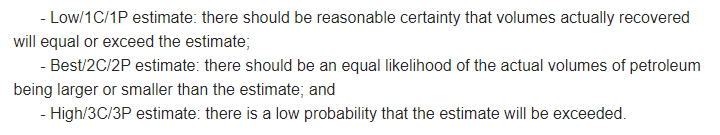
Hence in the E&P industry, it is easy to see why most investors and analysts refer to the 2P estimate as the best estimate for a company’s actual recoverable oil volumes. This is because 2P reserves (‘2P’ referring to ‘Proved and Probable’) are a middle estimate of the recoverable oil volumes legally recognized as “commercial”.
However, there’s nothing stopping you from including 2C resources (riskier) or utilizing 1P resources (conservative) as your estimate for total recoverable oil volumes, depending on your risk appetite. In this instance, the company has provided a snapshot of its 2P and 2C resources in its analyst presentation:

Basically, what the company is saying here is that by 2021, it will have classified as 2P reserves at least 23.7 million bbl from its Anasuria field and 20.5 million bbl from its North Sabah field – for total 2P reserves of 44.2 million bbl (we are ignoring the Australian VIC cluster as it is only estimated to reach first oil by 2022).
Furthermore, the company is stating that they have discovered (but not yet legally classified as “commercial”) a further 71 million bbl of oil from both the Anasuria and North Sabah fields, as well as the Marigold/Sunflower fields. If we include these 2C resources, the total potential recoverable oil volumes could exceed 100 million bbl.
In this report, we shall explore all valuation scenarios giving consideration to both 2P and 2C resources.
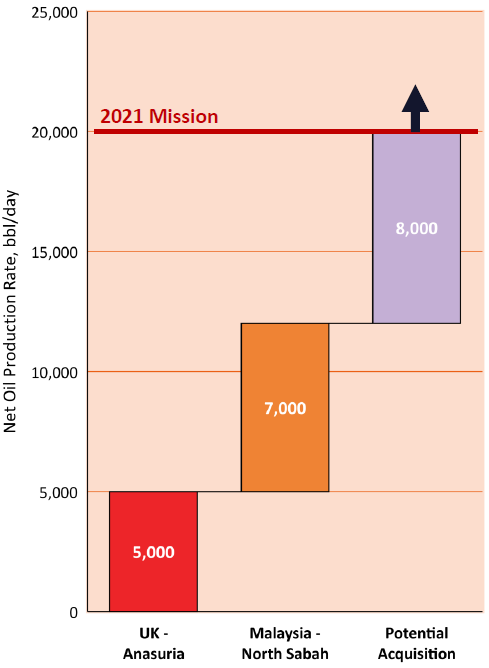
The company further targets a 2021 production rate of 20,000 bbl (LTM: 8,000 bbl), which includes 5,000 bbl from its Anasuria field (LTM: 2,500 bbl) and 7,000 bbl from its North Sabah field (LTM: 5,300 bbl).
This is a substantial increase in forecasted production from both existing and prospective oil fields. If it materializes, annual production rate could be as high as 7,300 mmbbl, and 2021 revenues (given FY20 USD/bbl of $60) could exceed RM 1.5 billion (FY20: RM 988 million).
However, this targeted forecast is quite a stretch from current production levels. Nevertheless, we shall consider all provided information in estimating a valuation for Hibiscus.
To understand Hibiscus’s oil production capacity and forecast its revenues and profits, we need to have a better appreciation of the performance of its two main cash-generating assets – the North Sabah field and the Anasuria field.
North Sabah oil field
Hibiscus owns a 50% interest in the North Sabah field together with its partner Petronas, and has production rights over the field up to year 2040. The asset contains 4 oil fields, namely the St Joseph field, South Furious field, SF 30 field and Barton field.
For the sake of brevity, we shall not delve deep into the operational aspects of the fields or the contractual nature of its production sharing contract (PSC). We’ll just focus on the factors which relate to its financial performance. These are:
Hence, we can conclude that management has a good handle on operational performance. It also implies that there is little room for further improvement in production resulting from increased uptime.
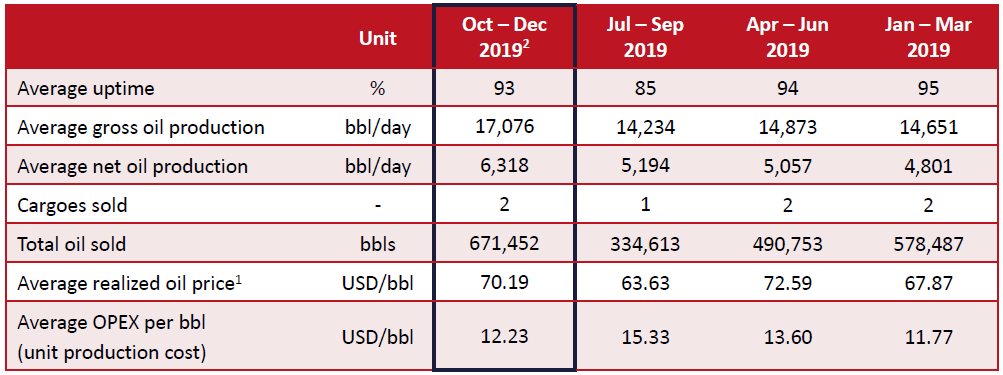
As North Sabah is under a production sharing contract (PSC), there is a distinction between gross oil production and net oil production. The former relates to total oil drawn out of the ground, whereas the latter refers to Hibiscus’s share of oil production after taxes, royalties and expenses are accounted for. In this case, we want to pay attention to net oil production, not gross.
We can arrive at Hibiscus’s total oil sold for the last twelve months (LTM) by adding up the total oil sold for each of the last 4 quarters. Summing up the figures yields total oil sold for the LTM of approximately 2,075,305 bbl.
Then, we can arrive at an average realized oil price over the LTM by averaging the average realized oil price for the last 4 quarters, giving us an average realized oil price over the LTM of USD 68.57/bbl. We can do the same for average OPEX per bbl, giving us an average OPEX per bbl over the LTM of USD 13.23/bbl.
Thus, we can sum up the above financial performance of the North Sabah field with the following figures:
Anasuria oil field
Doing the same exercise as above for the Anasuria field, we arrive at the following financial performance for the Anasuria field:
1 conservatively assuming USD:MYR exchange rate of 1:4 (2019 average: 4.1389)
Given that we have determined LTM EBITDA of RM 632m, the next step would be to subtract ITDA (interest, tax, depreciation & amortization) from it to obtain estimated LTM Net Profit. Using FY2020’s ITDA of approximately RM 318m as a guideline, we arrive at an estimated LTM Net Profit of RM 314m (FY20: 230m). Given the current market capitalization of RM 714.7m, this implies a trailing LTM PE of 2.3x.
Performing a sensitivity analysis given different oil prices, we arrive at the following net profit table for the company under different oil price scenarios, assuming oil production rate and ITDA remain constant:
From the above exercise, it becomes apparent that Hibiscus has a breakeven oil price of about USD 41.8863/bbl, and has a lot of operating leverage given the exponential rate of increase in its Net Profit with each consequent increase in oil prices.
Considering that the oil production rate (EBITDA) is likely to increase faster than ITDA’s proportion to revenues (fixed costs), at an implied PE of 4.33x, it seems likely that an investment in Hibiscus will be profitable over the next 10 years (with the assumption that oil prices will revert to the mean in the long-term).
As opposed to the profit/loss assessment in Valuation (Method 1), another way of performing a valuation would be to estimate its balance sheet value, i.e. total revenues from 2P Reserves, and assign a reasonable margin to it.
From the above, we understand that Hibiscus’s 2P reserves from the North Sabah and Anasuria fields alone are approximately 44.2 mmbbl (we ignore contribution from Australia’s VIC cluster as it hasn’t been developed yet).
Doing a similar sensitivity analysis of different oil prices as above, we arrive at the following estimated total revenues and accumulated net profit:
1 conservatively assuming USD:MYR exchange rate of 1:4 (2019 average: 4.1389)
Let’s assume that the above average of RM 9.68 billion in total realizable revenues from current 2P reserves holds true. If we assign a conservative Net Profit margin of 15% (FY20: 23%; past 5 years average: 16%), we arrive at estimated accumulated Net Profit from 2P Reserves of RM 1.452 billion. Given the current market capitalization of RM 714 million, we might be able to say that the equity is worth about twice the current share price.
However, it is understandable that some readers might feel that the figures used in the above estimate (e.g. net profit margin of 15%) were randomly plucked from the sky. So how do we reconcile them with figures from the financial statements? Fortunately, there appears to be a way to do just that.
Intangible Assets
I refer you to a figure in the financial statements which provides a shortcut to the valuation of 2P Reserves. This is the carrying value of Intangible Assets on the Balance Sheet.
As of 2QFY21, that amount was RM 1,468,860,000 (i.e. RM 1.468 billion).
Quite coincidentally, one might observe that this figure is dangerously close to the estimated accumulated Net Profit from 2P Reserves of RM 1.452 billion we calculated earlier. But why would this amount matter at all?
To answer that, I refer you to the notes of the Annual Report FY20 (AR20). On page 148 of the AR20, we find the following two paragraphs:
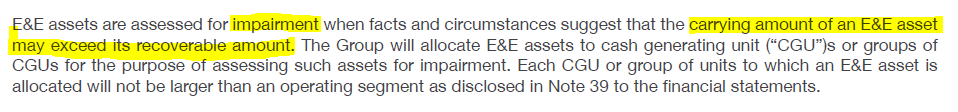
Hence, we can determine that firstly, the intangible asset value represents capitalized costs of acquisition of the oil fields, including technical exploration costs and costs of acquiring the relevant licenses. Secondly, an impairment review will be carried out when “the carrying amount of an E&E asset may exceed its recoverable amount”, with E&E assets being allocated to “cash generating units” (CGU) for the purposes of assessment.
On page 169 of the AR20, we find the following:
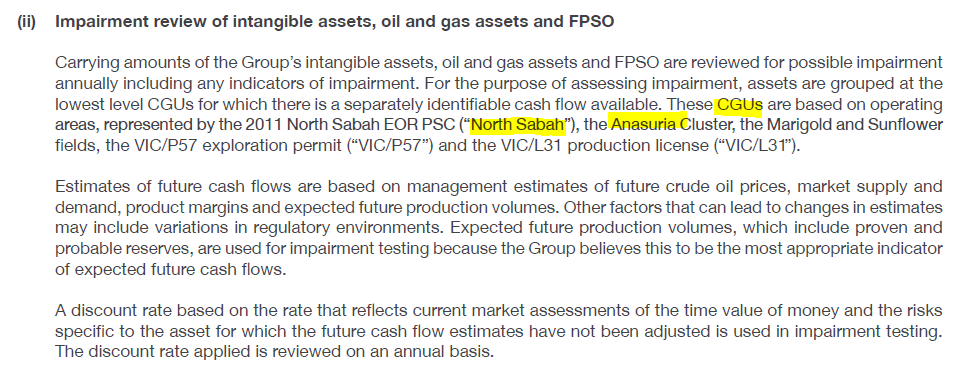
So apparently, the CGUs that have been assigned refer to the respective oil producing fields, two of which include the North Sabah field and the Anasuria field. In order to perform the impairment review, estimates of future cash flow will be made by management to assess the “recoverable amount” (as described above), subject to assumptions and an appropriate discount rate.
Hence, what we can gather up to now is that management will estimate future recoverable cash flows from a CGU (i.e. the North Sabah and Anasuria oil fields), compare that to their carrying value, and perform an impairment if their future recoverable cash flows are less than their carrying value. In other words, if estimated accumulated profits from the North Sabah and Anasuria oil fields are less than their carrying value, an impairment is required.
So where do we find the carrying values for the North Sabah and Anasuria oil fields? Further down on page 184 in the AR20, we see the following:
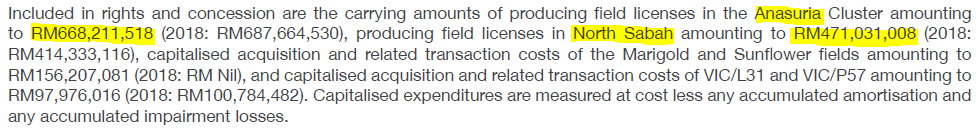
Hence, we can determine that the carrying values for the North Sabah and Anasuria oil fields are RM 471m and RM 668m respectively. But where do we find the future recoverable cash flows of the fields as estimated by management, and what are the assumptions used in that calculation?
Fortunately, we find just that on page 185:
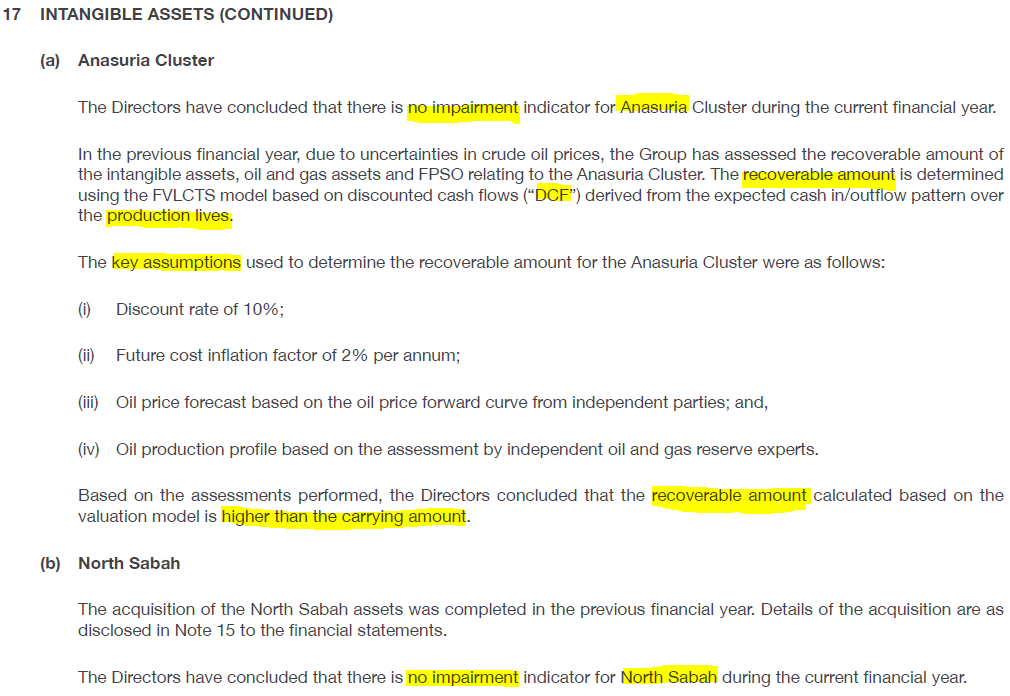
Here, we can see that the recoverable amount of the Anasuria field was estimated based on a DCF of expected future cash flows over the production life of the asset. The key assumptions used by management all seem appropriate, including a discount rate of 10% and oil price and oil production estimates based on independent assessment. From there, management concludes that the recoverable amount of the Anasuria field is higher than its carrying amount (i.e. no impairment required). Likewise, for the North Sabah field.
How do we interpret this? Basically, what management is saying is that given a 10% discount rate and independent oil price and oil production estimates, the accumulated profits (i.e. recoverable amount) from both the North Sabah and the Anasuria fields exceed their carrying amounts of RM 471m and RM 668m respectively.
In other words, according to management’s own estimates, the carrying value of the Intangible Assets of RM 1.468 billion approximates the accumulated Net Profit recoverable from 2P reserves.
To conclude Valuation (Method 2), we arrive at the following:
For the sake of brevity, I’ll only point out those line items which need extra attention, and skip over the rest. Feel free to go through the financial statements on your own to gain a better familiarity of the business.
Income Statement
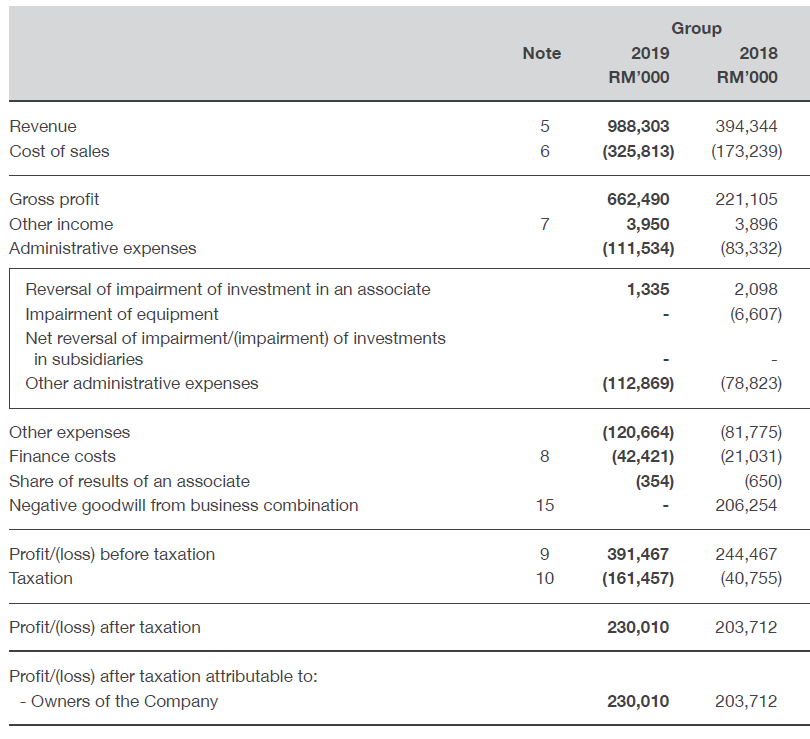
First, we’ll start with the Income Statement on page 135 of the AR20. Revenues are straightforward, as we’ve discussed above. Cost of Sales and Administrative Expenses fall under the jurisdiction of OPEX, which we’ve also seen earlier. Other Expenses are mostly made up of Depreciation & Amortization of RM 115m.
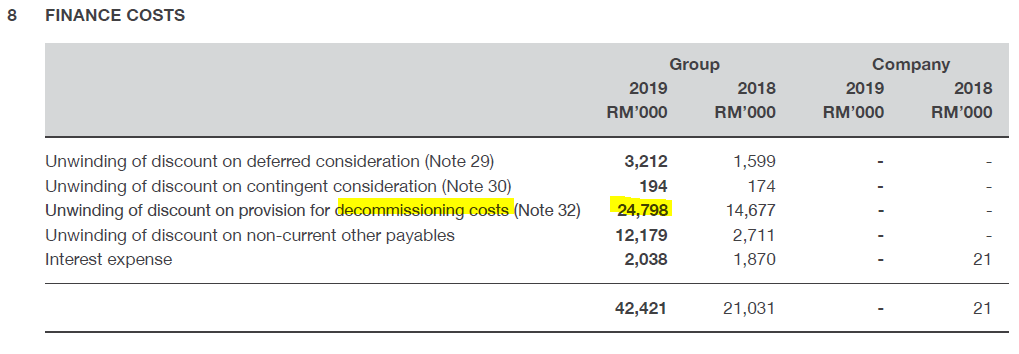
Finance Costs are where things start to get tricky. Why does a company which carries no debt have such huge amounts of finance costs? The reason can be found in Note 8, where it is revealed that the bulk of finance costs relate to the unwinding of discount of provision for decommissioning costs of RM 25m (Note 32).
This actually refers to the expected future costs of restoring the Anasuria and North Sabah fields to their original condition once the oil reserves have been depleted. Accounting standards require the company to provide for these decommissioning costs as they are estimable and probable. The way the decommissioning costs are accounted for is the same as an amortized loan, where the initial carrying value is recognized as a liability and the discount rate applied is reversed each year as an expense on the Income Statement. However, these expenses are largely non-cash in nature and do not necessitate a cash outflow every year (FY20: RM 69m).
Unwinding of discount on non-current other payables of RM 12m relate to contractual payments to the North Sabah sellers. We will discuss it later.
Taxation is another tricky subject, and is even more significant than Finance Costs at RM 161m. In gist, Hibiscus is subject to the 38% PITA (Petroleum Income Tax Act) under Malaysian jurisdiction, and the 30% Petroleum tax + 10% Supplementary tax under UK jurisdiction. Of the RM 161m, RM 41m of it relates to deferred tax which originates from the difference between tax treatment and accounting treatment on capitalized assets (accelerated depreciation vs straight-line depreciation). Nonetheless, what you should take away from this is that the tax expense is a tangible expense and material to breakeven analysis.
Fortunately, tax is a variable expense, and should not materially impact the cash flow of Hibiscus in today’s low oil price environment.
Note: Cash outflows for Tax Paid in FY20 was RM 97m, substantially below the RM 161m tax expense.
Balance Sheet
The balance sheet of Hibiscus is unexciting; I’ll just bring your attention to those line items which need additional scrutiny. I’ll use the figures in the latest 2Q21 quarterly report (2Q21) and refer to the notes in AR20 for clarity.
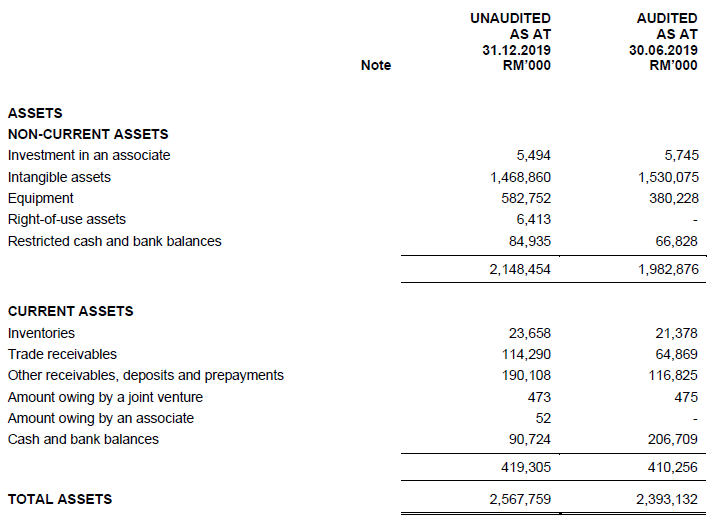
We’ve already discussed Intangible Assets in the section above, so I won’t dwell on it again.
Moving on, the company has Equipment of RM 582m, largely relating to O&G assets (e.g. the Anasuria FPSO vessel and CAPEX incurred on production enhancement projects). Restricted cash and bank balances represent contractual obligations for decommissioning costs of the Anasuria Cluster, and are inaccessible for use in operations.
Inventories are relatively low, despite Hibiscus being an E&P company, so forex fluctuations on carrying value of inventories are relatively immaterial. Trade receivables largely relate to entitlements from Petronas and BP (both oil supermajors), and are hence quite safe from impairment. Other receivables, deposits and prepayments are significant as they relate to security deposits placed with sellers of the oil fields acquired; these should be ignored for cash flow purposes.

Cash and bank balances of RM 90m do not include RM 105m of proceeds from offtake received in 3Q21 (Jan 2020). Hence, the actual cash and bank balances as of 2Q21 approximate RM 200m.
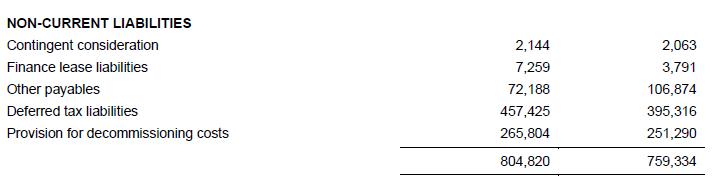
Liabilities are a little more interesting. First, I’ll draw your attention to the significant Deferred tax liabilities of RM 457m. These largely relate to the amortization of CAPEX (i.e. Equipment and capitalized E&E expenses), which is given an accelerated depreciation treatment for tax purposes.
The way this works is that the government gives Hibiscus a favorable tax treatment on capital expenditures incurred via an accelerated depreciation schedule, so that the taxable income is less than usual. However, this leads to the taxable depreciation being utilized quicker than accounting depreciation, hence the tax payable merely deferred to a later period – when the tax depreciation runs out but accounting depreciation remains. Given the capital intensive nature of the business, it is understandable why Deferred tax liabilities are so large.
We’ve discussed Provision for decommissioning costs under the Finance Costs section earlier. They are also quite significant at RM 266m.

Notably, the Other Payables and Accruals are a hefty RM 431m. What do they relate to? Basically, they are contractual obligations to the sellers of the oil fields which are only payable upon oil prices reaching certain thresholds. Hence, while they are current in nature, they will only become payable when oil prices recover to previous highs, and are hence not an immediate cash outflow concern given today’s low oil prices.
Cash Flow Statement
There is nothing in the cash flow statement which warrants concern.
Notably, the company generated OCF of approximately RM 500m in FY20 and RM 116m in 2Q21. It further incurred RM 330m and RM 234m of CAPEX in FY20 and 2Q21 respectively, largely owing to production enhancement projects to increase the production rate of the Anasuria and North Sabah fields, which according to management estimates are accretive to ROI.
Tax paid was RM 97m in FY20 and RM 61m in 2Q21 (tax expense: RM 161m and RM 62m respectively).
Oil prices remaining subdued
Of topmost concern in the minds of most analysts is whether Hibiscus has the wherewithal to sustain itself through this period of low oil prices (sub-$30). A quick and dirty estimate of annual cash outflow (i.e. burn rate) assuming a $20 oil world and historical production rates is between RM 50m-70m per year, which considering the RM 200m cash balance implies about 3-4 years of sustainability before the company runs out of cash and has to rely on external assistance for financing.
Table 1: Hibiscus EBITDA at different oil price and exchange rates
The above table shows different EBITDA scenarios (RM ‘m) given different oil prices (left column) and USD:MYR exchange rates (top row). Currently, oil prices are $27 and USD:MYR is 1:4.36.
Given conservative assumptions of average OPEX/bbl of $20 (current: $15), we can safely say that the company will be loss-making as long as oil remains at $20 or below (red). However, we can see that once oil prices hit $25, the company can tank the lower-end estimate of the annual burn rate of RM 50m (orange), while at RM $27 it can sufficiently muddle through the higher-end estimate of the annual burn rate of RM 70m (green).
Hence, we can assume that as long as the average oil price over the next 3-4 years remains above $25, Hibiscus should come out of this fine without the need for any external financing.
Customer Concentration Risk
With regards to customer concentration risk, there is not much the analyst or investor can do except to accept the risk. Fortunately, 80% of revenues can be attributed to two oil supermajors (Petronas and BP), hence the risk of default on contractual obligations and trade receivables seems to be quite diminished.
2P Reserves being less than estimated
2P Reserves being less than estimated is another risk that one should keep in mind. Fortunately, the current market cap is merely RM 714m – at half of estimated recoverable amounts of RM 1.468 billion – so there’s a decent margin of safety. In addition, there are other mitigating factors which shall be discussed in the next section (‘Opportunities’).
Significant non-current and current liabilities
The significant non-current and current liabilities have been addressed in the previous section. It has been determined that they pose no threat to immediate cash flow due to them being long-term in nature (e.g. decommissioning costs, deferred tax, etc). Hence, for the purpose of assessing going concern, their amounts should not be a cause for concern.
Potential issuance of equity
Finally, we come to the possibility of external financing being required in this low oil price environment. While the company should last 3-4 years on existing cash reserves, there is always the risk of other black swan events materializing (e.g. coronavirus) or simply oil prices remaining muted for longer than 4 years.
Furthermore, management has hinted that they wish to acquire new oil assets at presently depressed prices to increase daily production rate to a targeted 20,000 bbl by end-2021. They have room to acquire debt, but they may also wish to issue equity for this purpose. Hence, the possibility of dilution to existing shareholders cannot be entirely ruled out.
However, given management’s historical track record of prioritizing ROI and optimal capital allocation, and in consideration of the fact that the MD owns 10% of outstanding shares, there is some assurance that any potential acquisitions will be accretive to EPS and therefore valuations.
Increased Daily Oil Production Rate
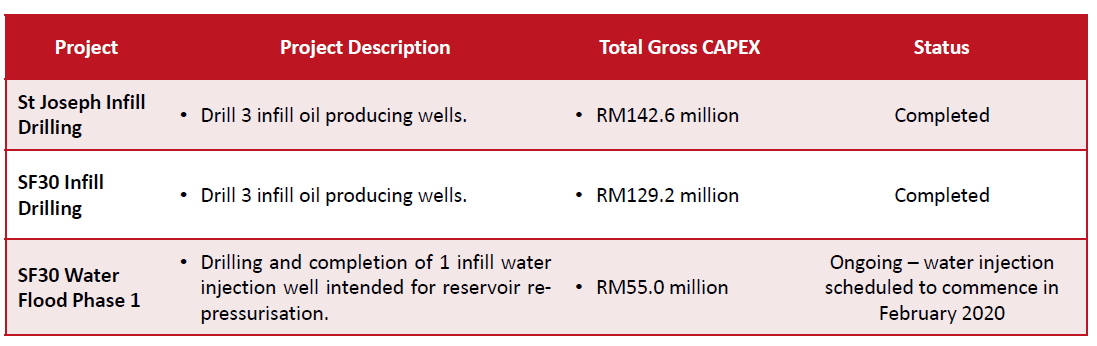
The first and most obvious opportunity is the potential for increased production rate. We’ve seen in the last quarter (2Q21) that the North Sabah field increased its daily production rate by approximately 20% as a result of production enhancement projects (infill drilling), lowering OPEX/bbl as a result. To vastly oversimplify, infill drilling is the process of maximizing well density by drilling in the spaces between existing wells to improve oil production.
The same improvements are being undertaken at the Anasuria field via infill drilling, subsea debottlenecking, water injection and sidetracking of existing wells. Without boring you with industry jargon, this basically means future production rate is likely to improve going forward.

By how much can the oil production rate be improved by? Management estimates in their analyst presentation that enhancements in the Anasuria field will be able to yield 5,000 bbl/day by 2021 (current: 2,500 bbl/day).
Similarly, improvements in the North Sabah field is expected to yield 7,000 bbl/day by 2021 (current: 5,300 bbl/day).
This implies a total 2021 expected daily production rate from the two fields alone of 12,000 bbl/day (current: 8,000 bbl/day). That’s a 50% increase in yields which we haven’t factored into our valuation yet.
Furthermore, we haven’t considered any production from existing 2C resources (e.g. Marigold/Sunflower) or any potential acquisitions which may occur in the future. By management estimates, this can potentially increase production by another 8,000 bbl/day, bringing total production to 20,000 bbl/day.
While this seems like a stretch of the imagination, it pays to keep them in mind when forecasting future revenues and valuations.
Just to play around with the numbers, I’ve come up with a sensitivity analysis of possible annual EBITDA at different oil prices and daily oil production rates:
Table 2: Hibiscus EBITDA at different oil price and daily oil production rates
* assumes average OPEX/bbl of $20 (current: $15) and USD:MYR exchange rate of 1:4 (current: 1:4.36)
The left column represents different oil prices while the top row represents different daily oil production rates.
The green column represents EBITDA at current daily production rate of 8,000 bbl/day; the orange column represents EBITDA at targeted daily production rate of 12,000 bbl/day; while the purple column represents EBITDA at maximum daily production rate of 20,000 bbl/day.
Even conservatively assuming increased estimated annual ITDA of RM 500m (FY20: RM 318m), and long-term average oil prices of $50 (FY20: $60), the estimated Net Profit and P/E ratio is potentially lucrative at daily oil production rates of 12,000 bbl/day and above.
2C Resources
Since we’re on the topic of improved daily oil production rate, it bears to pay in mind the relatively enormous potential from Hibiscus’s 2C Resources. North Sabah’s 2C Resources alone exceed 30 mmbbl; while those from the yet undiagnosed Marigold/Sunflower fields also reach 30 mmbbl. Altogether, 2C Resources exceed 70 mmbbl, which dwarfs the 44 mmbbl of 2P Reserves we have considered up to this point in our valuation estimates.

To refresh your memory, 2C Resources represents oil volumes which have been discovered but are not yet classified as “commercial”. This means that there is reasonable certainty of the oil being recoverable, as opposed to simply being in the very early stages of exploration. So, to be conservative, we will imagine that only 50% of 2C Resources are eligible for reclassification to 2P reserves, i.e. 35 mmbbl of oil.
This additional 35 mmbbl of oil represents an 80% increase to existing 2P reserves. Assuming the daily oil production rate increases similarly by 80%, we will arrive at 14,400 bbl/day of oil production. According to Table 2 above, this would yield an EBITDA of roughly RM 630m assuming $50 oil.
Comparing that estimated EBITDA to FY20’s actual EBITDA:
Hence, even conservatively assuming lower oil prices and higher OPEX/bbl (which should decrease in the presence of higher oil volumes) than last year, we get approximately the same EBITDA as FY20.
For the sake of completeness, let’s assume that Hibiscus issues twice the no. of existing shares over the next 10 years, effectively diluting shareholders by 50%. Even without accounting for the possibility of the acquisition of new oil fields, at the current market capitalization of RM 714m, the prospective P/E would be about 10x. Not too shabby.
Future oil prices exceeding $50 and effects from coronavirus dissipating
Hibiscus shares have recently been hit by a one-two punch from oil prices cratering from $60 to $30, as a result of both the Saudi-Russian dispute and depressed demand for oil due to coronavirus. This has massively increased supply and at the same time hugely depressed demand for oil (due to the globally coordinated lockdowns being implemented).
Given a long enough timeframe, I fully expect OPEC+ to come to an agreement and the economic effects from the coronavirus to dissipate, allowing oil prices to rebound. As we equity investors are aware, oil prices are cyclical and are bound to recover over the next 10 years.
When it does, valuations of O&G stocks (including Hibiscus’s) are likely to improve as investors overshoot expectations and begin to forecast higher oil prices into perpetuity, as they always tend to do in good times. When that time arrives, Hibiscus’s valuations are likely to become overoptimistic as all O&G stocks tend to do during oil upcycles, resulting in valuations far exceeding reasonable estimates of future earnings. If you can hold the shares up until then, it’s likely you will make much more on your investment than what we’ve been estimating.
Download PDF of this article here: https://docdro.id/oxRgeM1
In light of the recent fall in oil prices due to the Saudi-Russian dispute and dampening demand for oil due to the lockdowns implemented globally, O&G stocks have taken a severe beating, falling approximately 50% from their highs at the beginning of the year. Not spared from this onslaught is Hibiscus Petroleum Berhad (Hibiscus), a listed oil and gas (O&G) exploration and production (E&P) company.
Why invest in O&G stocks in this particularly uncertain period? For one, valuations of these stocks have fallen to multi-year lows, bringing the potential ROI on these stocks to attractive levels. Oil prices are cyclical, and are bound to return to the mean given a sufficiently long time horizon. The trick is to find those companies who can survive through this downturn and emerge into “normal” profitability once oil prices rebound.
In this article, I will explore the upsides and downsides of investing in Hibiscus. I will do my best to cater this report to newcomers to the O&G industry – rather than address exclusively experts and veterans of the O&G sector. As an equity analyst, I aim to provide a view on the company primarily, and will generally refrain from providing macro views on oil or opinions about secular trends of the sector. I hope you enjoy reading it!
Stock code: 5199.KL
Stock name: Hibiscus Petroleum Berhad
Financial information and financial reports: https://www.malaysiastock.biz/Corporate-Infomation.aspx?securityCode=5199
Company website: https://www.hibiscuspetroleum.com/
Company Snapshot
Hibiscus Petroleum Berhad (5199.KL) is an oil and gas (O&G) upstream exploration and production (E&P) company located in Malaysia. As an E&P company, their business can be basically described as:- looking for oil,
- drawing it out of the ground, and
- selling it on global oil markets.
While the company is domiciled in Malaysia, its two main oil producing fields are located in both Malaysia and the UK. The Malaysian oil field is commonly referred to as the North Sabah field, while the UK oil field is commonly referred to as the Anasuria oil field. Hibiscus has licenses to other oil fields in different parts of the world, notably the Marigold/Sunflower oil fields in the UK and the VIC cluster in Australia, but its revenues and profits mainly stem from the former two oil producing fields.
Given that it’s a small player and has only two primary producing oil fields, it’s not surprising that Hibiscus sells its oil to a concentrated pool of customers, with 2 of them representing 80% of its revenues (i.e. Petronas and BP). Fortunately, both these customers are oil supermajors, and are unlikely to default on their obligations despite low oil prices.
At RM 0.45 per share, the market capitalization is RM 714.7m and it has a trailing PE ratio of about 5x. It doesn’t carry any debt, and it hasn’t paid a dividend in its listing history. The MD, Mr. Kenneth Gerard Pereira, owns about 10% of the company’s outstanding shares.
Reserves (Total recoverable oil) & Production (bbl/day)
To begin analyzing the company, it’s necessary to understand a little of the industry jargon. We’ll start with Reserves and Production.In general, there are three types of categories for a company’s recoverable oil volumes – Reserves, Contingent Resources and Prospective Resources. Reserves are those oil fields which are “commercial”, which is defined as below:
Contingent Resources and Prospective Resources are further defined as below:
In the industry lingo, we generally refer to Reserves as ‘P’ and Contingent Resources as ‘C’. These ‘P’ and ‘C’ resources can be further categorized into 1P/2P/3P resources and 1C/2C/3C resources, each referring to a low/medium/high estimate of the company’s potential recoverable oil volumes:
Hence in the E&P industry, it is easy to see why most investors and analysts refer to the 2P estimate as the best estimate for a company’s actual recoverable oil volumes. This is because 2P reserves (‘2P’ referring to ‘Proved and Probable’) are a middle estimate of the recoverable oil volumes legally recognized as “commercial”.
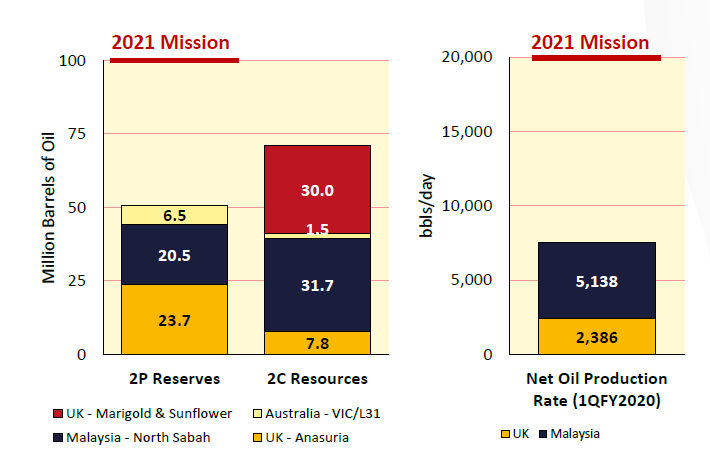
However, there’s nothing stopping you from including 2C resources (riskier) or utilizing 1P resources (conservative) as your estimate for total recoverable oil volumes, depending on your risk appetite. In this instance, the company has provided a snapshot of its 2P and 2C resources in its analyst presentation:
Basically, what the company is saying here is that by 2021, it will have classified as 2P reserves at least 23.7 million bbl from its Anasuria field and 20.5 million bbl from its North Sabah field – for total 2P reserves of 44.2 million bbl (we are ignoring the Australian VIC cluster as it is only estimated to reach first oil by 2022).
Furthermore, the company is stating that they have discovered (but not yet legally classified as “commercial”) a further 71 million bbl of oil from both the Anasuria and North Sabah fields, as well as the Marigold/Sunflower fields. If we include these 2C resources, the total potential recoverable oil volumes could exceed 100 million bbl.
In this report, we shall explore all valuation scenarios giving consideration to both 2P and 2C resources.
The company further targets a 2021 production rate of 20,000 bbl (LTM: 8,000 bbl), which includes 5,000 bbl from its Anasuria field (LTM: 2,500 bbl) and 7,000 bbl from its North Sabah field (LTM: 5,300 bbl).
This is a substantial increase in forecasted production from both existing and prospective oil fields. If it materializes, annual production rate could be as high as 7,300 mmbbl, and 2021 revenues (given FY20 USD/bbl of $60) could exceed RM 1.5 billion (FY20: RM 988 million).
However, this targeted forecast is quite a stretch from current production levels. Nevertheless, we shall consider all provided information in estimating a valuation for Hibiscus.
To understand Hibiscus’s oil production capacity and forecast its revenues and profits, we need to have a better appreciation of the performance of its two main cash-generating assets – the North Sabah field and the Anasuria field.
North Sabah oil field
Hibiscus owns a 50% interest in the North Sabah field together with its partner Petronas, and has production rights over the field up to year 2040. The asset contains 4 oil fields, namely the St Joseph field, South Furious field, SF 30 field and Barton field.
For the sake of brevity, we shall not delve deep into the operational aspects of the fields or the contractual nature of its production sharing contract (PSC). We’ll just focus on the factors which relate to its financial performance. These are:
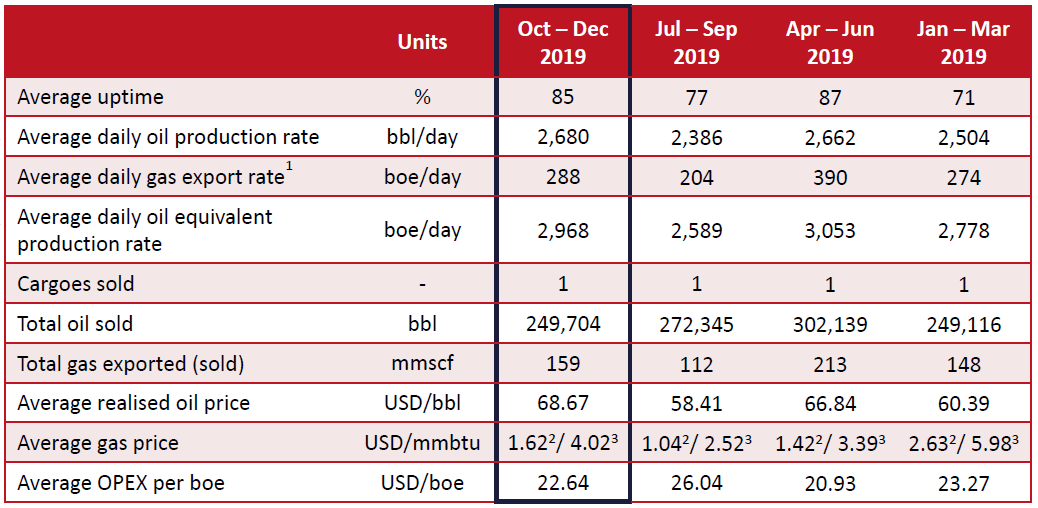
- Average uptime
- Total oil sold
- Average realized oil price
- Average OPEX per bbl
Hence, we can conclude that management has a good handle on operational performance. It also implies that there is little room for further improvement in production resulting from increased uptime.
As North Sabah is under a production sharing contract (PSC), there is a distinction between gross oil production and net oil production. The former relates to total oil drawn out of the ground, whereas the latter refers to Hibiscus’s share of oil production after taxes, royalties and expenses are accounted for. In this case, we want to pay attention to net oil production, not gross.
We can arrive at Hibiscus’s total oil sold for the last twelve months (LTM) by adding up the total oil sold for each of the last 4 quarters. Summing up the figures yields total oil sold for the LTM of approximately 2,075,305 bbl.
Then, we can arrive at an average realized oil price over the LTM by averaging the average realized oil price for the last 4 quarters, giving us an average realized oil price over the LTM of USD 68.57/bbl. We can do the same for average OPEX per bbl, giving us an average OPEX per bbl over the LTM of USD 13.23/bbl.
Thus, we can sum up the above financial performance of the North Sabah field with the following figures:
- Total oil sold: 2,075,305 bbl
- Average realized oil price: USD 68.57/bbl
- Average OPEX per bbl: USD 13.23/bbl
Anasuria oil field
Doing the same exercise as above for the Anasuria field, we arrive at the following financial performance for the Anasuria field:
- Total oil sold: 1,073,304 bbl
- Average realized oil price: USD 63.57/bbl
- Average OPEX per bbl: USD 23.22/bbl
Valuation (Method 1)
Putting the figures from both oil fields together, we get the following data:| North Sabah | Anasuria | Total | |
| Total oil sold (bbl) | 2,075,305 | 1,073,304 | 3,148,609 |
| Average realized oil price (USD/bbl) | 68.57 | 63.57 | |
| Average OPEX per bbl (USD/bbl) | 13.23 | 23.22 | |
| Revenue (USD) | 142,303,664 | 68,237,985 | 210,541,649 |
| EBITDA (USD) | 114,842,190 | 43,315,866 | 158,158,057 |
| Revenue (MYR) 1 | 569,214,655 | 272,951,940 | 842,166,596 |
| EBITDA (MYR)1 | 459,368,762 | 173,263,465 | 632,632,226 |
Given that we have determined LTM EBITDA of RM 632m, the next step would be to subtract ITDA (interest, tax, depreciation & amortization) from it to obtain estimated LTM Net Profit. Using FY2020’s ITDA of approximately RM 318m as a guideline, we arrive at an estimated LTM Net Profit of RM 314m (FY20: 230m). Given the current market capitalization of RM 714.7m, this implies a trailing LTM PE of 2.3x.
Performing a sensitivity analysis given different oil prices, we arrive at the following net profit table for the company under different oil price scenarios, assuming oil production rate and ITDA remain constant:
| Oil Price (USD/bbl) | Estimated Net Profit (RM) |
| 10 | -401,590,009 |
| 20 | -275,645,649 |
| 30 | -149,701,289 |
| 40 | -23,756,929 |
| 41.8863 | -45 (i.e. breakeven) |
| 50 | 102,187,431 |
| 60 | 228,131,791 |
| 70 | 354,076,151 |
| 80 | 480,020,511 |
| 90 | 605,984,871 |
| 100 | 731,909,231 |
| Average | 165,159,611 |
| Implied PE (MC: 714m) | 4.33x |
From the above exercise, it becomes apparent that Hibiscus has a breakeven oil price of about USD 41.8863/bbl, and has a lot of operating leverage given the exponential rate of increase in its Net Profit with each consequent increase in oil prices.
Considering that the oil production rate (EBITDA) is likely to increase faster than ITDA’s proportion to revenues (fixed costs), at an implied PE of 4.33x, it seems likely that an investment in Hibiscus will be profitable over the next 10 years (with the assumption that oil prices will revert to the mean in the long-term).
Valuation (Method 2)
Of course, there are a lot of assumptions behind the above method of valuation. Hence, it would be prudent to perform multiple methods of valuation and compare the figures to one another.As opposed to the profit/loss assessment in Valuation (Method 1), another way of performing a valuation would be to estimate its balance sheet value, i.e. total revenues from 2P Reserves, and assign a reasonable margin to it.
From the above, we understand that Hibiscus’s 2P reserves from the North Sabah and Anasuria fields alone are approximately 44.2 mmbbl (we ignore contribution from Australia’s VIC cluster as it hasn’t been developed yet).
Doing a similar sensitivity analysis of different oil prices as above, we arrive at the following estimated total revenues and accumulated net profit:
| Oil Price (USD/bbl) | Estimated accumulated Revenues from 2P reserves (RM ‘m)1 |
| 10 | 1,760 |
| 20 | 3,520 |
| 30 | 5,280 |
| 40 | 7,040 |
| 50 | 8,800 |
| 60 | 10,560 |
| 70 | 12,320 |
| 80 | 14,080 |
| 90 | 15,840 |
| 100 | 17,600 |
| Average | 9,680 |
Let’s assume that the above average of RM 9.68 billion in total realizable revenues from current 2P reserves holds true. If we assign a conservative Net Profit margin of 15% (FY20: 23%; past 5 years average: 16%), we arrive at estimated accumulated Net Profit from 2P Reserves of RM 1.452 billion. Given the current market capitalization of RM 714 million, we might be able to say that the equity is worth about twice the current share price.
However, it is understandable that some readers might feel that the figures used in the above estimate (e.g. net profit margin of 15%) were randomly plucked from the sky. So how do we reconcile them with figures from the financial statements? Fortunately, there appears to be a way to do just that.
Intangible Assets
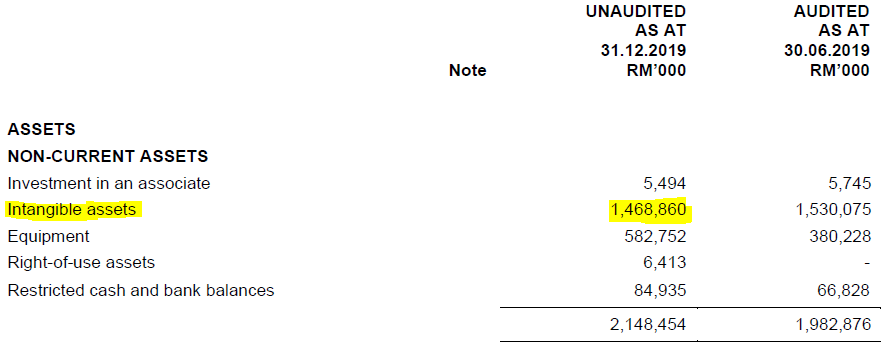
I refer you to a figure in the financial statements which provides a shortcut to the valuation of 2P Reserves. This is the carrying value of Intangible Assets on the Balance Sheet.
As of 2QFY21, that amount was RM 1,468,860,000 (i.e. RM 1.468 billion).
Quite coincidentally, one might observe that this figure is dangerously close to the estimated accumulated Net Profit from 2P Reserves of RM 1.452 billion we calculated earlier. But why would this amount matter at all?
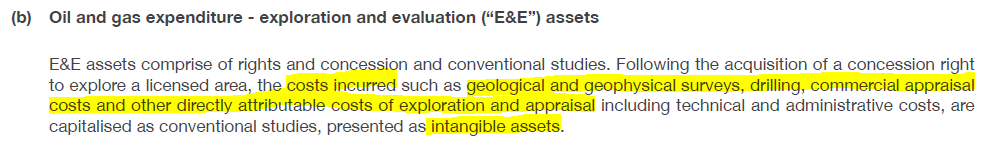
To answer that, I refer you to the notes of the Annual Report FY20 (AR20). On page 148 of the AR20, we find the following two paragraphs:
Hence, we can determine that firstly, the intangible asset value represents capitalized costs of acquisition of the oil fields, including technical exploration costs and costs of acquiring the relevant licenses. Secondly, an impairment review will be carried out when “the carrying amount of an E&E asset may exceed its recoverable amount”, with E&E assets being allocated to “cash generating units” (CGU) for the purposes of assessment.
On page 169 of the AR20, we find the following:
So apparently, the CGUs that have been assigned refer to the respective oil producing fields, two of which include the North Sabah field and the Anasuria field. In order to perform the impairment review, estimates of future cash flow will be made by management to assess the “recoverable amount” (as described above), subject to assumptions and an appropriate discount rate.
Hence, what we can gather up to now is that management will estimate future recoverable cash flows from a CGU (i.e. the North Sabah and Anasuria oil fields), compare that to their carrying value, and perform an impairment if their future recoverable cash flows are less than their carrying value. In other words, if estimated accumulated profits from the North Sabah and Anasuria oil fields are less than their carrying value, an impairment is required.
So where do we find the carrying values for the North Sabah and Anasuria oil fields? Further down on page 184 in the AR20, we see the following:
Hence, we can determine that the carrying values for the North Sabah and Anasuria oil fields are RM 471m and RM 668m respectively. But where do we find the future recoverable cash flows of the fields as estimated by management, and what are the assumptions used in that calculation?
Fortunately, we find just that on page 185:
Here, we can see that the recoverable amount of the Anasuria field was estimated based on a DCF of expected future cash flows over the production life of the asset. The key assumptions used by management all seem appropriate, including a discount rate of 10% and oil price and oil production estimates based on independent assessment. From there, management concludes that the recoverable amount of the Anasuria field is higher than its carrying amount (i.e. no impairment required). Likewise, for the North Sabah field.
How do we interpret this? Basically, what management is saying is that given a 10% discount rate and independent oil price and oil production estimates, the accumulated profits (i.e. recoverable amount) from both the North Sabah and the Anasuria fields exceed their carrying amounts of RM 471m and RM 668m respectively.
In other words, according to management’s own estimates, the carrying value of the Intangible Assets of RM 1.468 billion approximates the accumulated Net Profit recoverable from 2P reserves.
To conclude Valuation (Method 2), we arrive at the following:
| Our estimates | Management estimates | |
| Accumulated Net Profit from 2P Reserves | RM 1.452 billion | RM 1.468 billion |
Financials
By now, we have established the basic economics of Hibiscus’s business, including its revenues (i.e. oil production and oil price scenarios), costs (OPEX, ITDA), profitability (breakeven, future earnings potential) and balance sheet value (2P reserves, valuation). Moving on, we want to gain a deeper understanding of the 3 statements to anticipate any blind spots and risks. We’ll refer to the financial statements of both the FY20 annual report and the 2Q21 quarterly report in this analysis.For the sake of brevity, I’ll only point out those line items which need extra attention, and skip over the rest. Feel free to go through the financial statements on your own to gain a better familiarity of the business.
Income Statement
First, we’ll start with the Income Statement on page 135 of the AR20. Revenues are straightforward, as we’ve discussed above. Cost of Sales and Administrative Expenses fall under the jurisdiction of OPEX, which we’ve also seen earlier. Other Expenses are mostly made up of Depreciation & Amortization of RM 115m.
Finance Costs are where things start to get tricky. Why does a company which carries no debt have such huge amounts of finance costs? The reason can be found in Note 8, where it is revealed that the bulk of finance costs relate to the unwinding of discount of provision for decommissioning costs of RM 25m (Note 32).
This actually refers to the expected future costs of restoring the Anasuria and North Sabah fields to their original condition once the oil reserves have been depleted. Accounting standards require the company to provide for these decommissioning costs as they are estimable and probable. The way the decommissioning costs are accounted for is the same as an amortized loan, where the initial carrying value is recognized as a liability and the discount rate applied is reversed each year as an expense on the Income Statement. However, these expenses are largely non-cash in nature and do not necessitate a cash outflow every year (FY20: RM 69m).
Unwinding of discount on non-current other payables of RM 12m relate to contractual payments to the North Sabah sellers. We will discuss it later.
Taxation is another tricky subject, and is even more significant than Finance Costs at RM 161m. In gist, Hibiscus is subject to the 38% PITA (Petroleum Income Tax Act) under Malaysian jurisdiction, and the 30% Petroleum tax + 10% Supplementary tax under UK jurisdiction. Of the RM 161m, RM 41m of it relates to deferred tax which originates from the difference between tax treatment and accounting treatment on capitalized assets (accelerated depreciation vs straight-line depreciation). Nonetheless, what you should take away from this is that the tax expense is a tangible expense and material to breakeven analysis.
Fortunately, tax is a variable expense, and should not materially impact the cash flow of Hibiscus in today’s low oil price environment.
Note: Cash outflows for Tax Paid in FY20 was RM 97m, substantially below the RM 161m tax expense.
Balance Sheet
The balance sheet of Hibiscus is unexciting; I’ll just bring your attention to those line items which need additional scrutiny. I’ll use the figures in the latest 2Q21 quarterly report (2Q21) and refer to the notes in AR20 for clarity.
We’ve already discussed Intangible Assets in the section above, so I won’t dwell on it again.
Moving on, the company has Equipment of RM 582m, largely relating to O&G assets (e.g. the Anasuria FPSO vessel and CAPEX incurred on production enhancement projects). Restricted cash and bank balances represent contractual obligations for decommissioning costs of the Anasuria Cluster, and are inaccessible for use in operations.
Inventories are relatively low, despite Hibiscus being an E&P company, so forex fluctuations on carrying value of inventories are relatively immaterial. Trade receivables largely relate to entitlements from Petronas and BP (both oil supermajors), and are hence quite safe from impairment. Other receivables, deposits and prepayments are significant as they relate to security deposits placed with sellers of the oil fields acquired; these should be ignored for cash flow purposes.
Cash and bank balances of RM 90m do not include RM 105m of proceeds from offtake received in 3Q21 (Jan 2020). Hence, the actual cash and bank balances as of 2Q21 approximate RM 200m.
Liabilities are a little more interesting. First, I’ll draw your attention to the significant Deferred tax liabilities of RM 457m. These largely relate to the amortization of CAPEX (i.e. Equipment and capitalized E&E expenses), which is given an accelerated depreciation treatment for tax purposes.
The way this works is that the government gives Hibiscus a favorable tax treatment on capital expenditures incurred via an accelerated depreciation schedule, so that the taxable income is less than usual. However, this leads to the taxable depreciation being utilized quicker than accounting depreciation, hence the tax payable merely deferred to a later period – when the tax depreciation runs out but accounting depreciation remains. Given the capital intensive nature of the business, it is understandable why Deferred tax liabilities are so large.
We’ve discussed Provision for decommissioning costs under the Finance Costs section earlier. They are also quite significant at RM 266m.
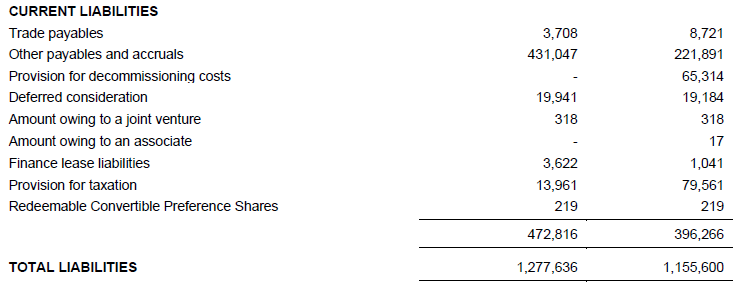
Notably, the Other Payables and Accruals are a hefty RM 431m. What do they relate to? Basically, they are contractual obligations to the sellers of the oil fields which are only payable upon oil prices reaching certain thresholds. Hence, while they are current in nature, they will only become payable when oil prices recover to previous highs, and are hence not an immediate cash outflow concern given today’s low oil prices.
Cash Flow Statement
There is nothing in the cash flow statement which warrants concern.
Notably, the company generated OCF of approximately RM 500m in FY20 and RM 116m in 2Q21. It further incurred RM 330m and RM 234m of CAPEX in FY20 and 2Q21 respectively, largely owing to production enhancement projects to increase the production rate of the Anasuria and North Sabah fields, which according to management estimates are accretive to ROI.
Tax paid was RM 97m in FY20 and RM 61m in 2Q21 (tax expense: RM 161m and RM 62m respectively).
Risks
There are a few obvious and not-so-obvious risks that one should be aware of before investing in Hibiscus. We shall not consider operational risks (e.g. uptime, OPEX) as they are outside the jurisdiction of the equity analyst. Instead, we shall focus on the financial and strategic risks largely outside the control of management. The main ones are:- Oil prices remaining subdued for long periods of time
- Fluctuation of exchange rates
- Customer concentration risk
- 2P Reserves being less than estimated
- Significant current and non-current liabilities
- Potential issuance of equity
Oil prices remaining subdued
Of topmost concern in the minds of most analysts is whether Hibiscus has the wherewithal to sustain itself through this period of low oil prices (sub-$30). A quick and dirty estimate of annual cash outflow (i.e. burn rate) assuming a $20 oil world and historical production rates is between RM 50m-70m per year, which considering the RM 200m cash balance implies about 3-4 years of sustainability before the company runs out of cash and has to rely on external assistance for financing.
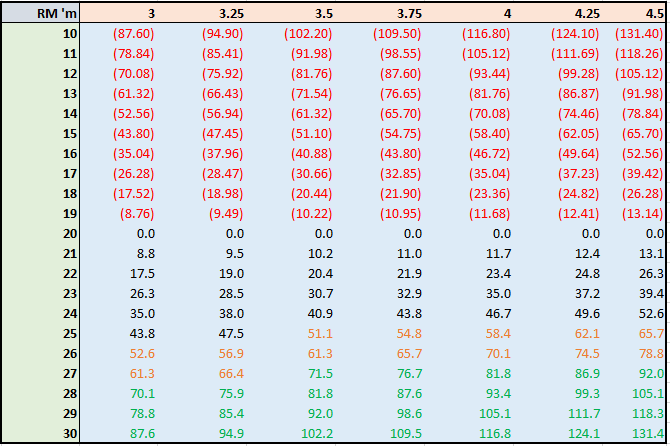
Table 1: Hibiscus EBITDA at different oil price and exchange rates
The above table shows different EBITDA scenarios (RM ‘m) given different oil prices (left column) and USD:MYR exchange rates (top row). Currently, oil prices are $27 and USD:MYR is 1:4.36.
Given conservative assumptions of average OPEX/bbl of $20 (current: $15), we can safely say that the company will be loss-making as long as oil remains at $20 or below (red). However, we can see that once oil prices hit $25, the company can tank the lower-end estimate of the annual burn rate of RM 50m (orange), while at RM $27 it can sufficiently muddle through the higher-end estimate of the annual burn rate of RM 70m (green).
Hence, we can assume that as long as the average oil price over the next 3-4 years remains above $25, Hibiscus should come out of this fine without the need for any external financing.
Customer Concentration Risk
With regards to customer concentration risk, there is not much the analyst or investor can do except to accept the risk. Fortunately, 80% of revenues can be attributed to two oil supermajors (Petronas and BP), hence the risk of default on contractual obligations and trade receivables seems to be quite diminished.
2P Reserves being less than estimated
2P Reserves being less than estimated is another risk that one should keep in mind. Fortunately, the current market cap is merely RM 714m – at half of estimated recoverable amounts of RM 1.468 billion – so there’s a decent margin of safety. In addition, there are other mitigating factors which shall be discussed in the next section (‘Opportunities’).
Significant non-current and current liabilities
The significant non-current and current liabilities have been addressed in the previous section. It has been determined that they pose no threat to immediate cash flow due to them being long-term in nature (e.g. decommissioning costs, deferred tax, etc). Hence, for the purpose of assessing going concern, their amounts should not be a cause for concern.
Potential issuance of equity
Finally, we come to the possibility of external financing being required in this low oil price environment. While the company should last 3-4 years on existing cash reserves, there is always the risk of other black swan events materializing (e.g. coronavirus) or simply oil prices remaining muted for longer than 4 years.
Furthermore, management has hinted that they wish to acquire new oil assets at presently depressed prices to increase daily production rate to a targeted 20,000 bbl by end-2021. They have room to acquire debt, but they may also wish to issue equity for this purpose. Hence, the possibility of dilution to existing shareholders cannot be entirely ruled out.
However, given management’s historical track record of prioritizing ROI and optimal capital allocation, and in consideration of the fact that the MD owns 10% of outstanding shares, there is some assurance that any potential acquisitions will be accretive to EPS and therefore valuations.
Opportunities
As with the existence of risk, the presence of material opportunities also looms over the company. Some of them are discussed below:- Increased Daily Oil Production Rate
- Inclusion of 2C Resources
- Future oil prices exceeding $50 and effects from coronavirus dissipating
Increased Daily Oil Production Rate
The first and most obvious opportunity is the potential for increased production rate. We’ve seen in the last quarter (2Q21) that the North Sabah field increased its daily production rate by approximately 20% as a result of production enhancement projects (infill drilling), lowering OPEX/bbl as a result. To vastly oversimplify, infill drilling is the process of maximizing well density by drilling in the spaces between existing wells to improve oil production.
The same improvements are being undertaken at the Anasuria field via infill drilling, subsea debottlenecking, water injection and sidetracking of existing wells. Without boring you with industry jargon, this basically means future production rate is likely to improve going forward.
By how much can the oil production rate be improved by? Management estimates in their analyst presentation that enhancements in the Anasuria field will be able to yield 5,000 bbl/day by 2021 (current: 2,500 bbl/day).
Similarly, improvements in the North Sabah field is expected to yield 7,000 bbl/day by 2021 (current: 5,300 bbl/day).
This implies a total 2021 expected daily production rate from the two fields alone of 12,000 bbl/day (current: 8,000 bbl/day). That’s a 50% increase in yields which we haven’t factored into our valuation yet.
Furthermore, we haven’t considered any production from existing 2C resources (e.g. Marigold/Sunflower) or any potential acquisitions which may occur in the future. By management estimates, this can potentially increase production by another 8,000 bbl/day, bringing total production to 20,000 bbl/day.
While this seems like a stretch of the imagination, it pays to keep them in mind when forecasting future revenues and valuations.
Just to play around with the numbers, I’ve come up with a sensitivity analysis of possible annual EBITDA at different oil prices and daily oil production rates:
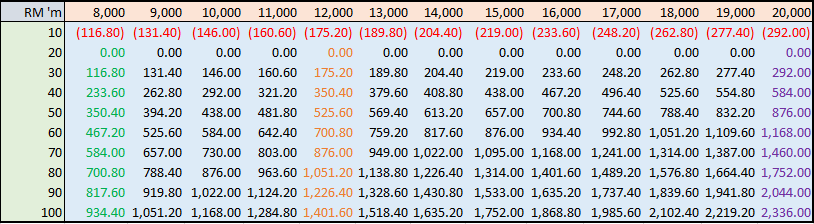
Table 2: Hibiscus EBITDA at different oil price and daily oil production rates
* assumes average OPEX/bbl of $20 (current: $15) and USD:MYR exchange rate of 1:4 (current: 1:4.36)
The left column represents different oil prices while the top row represents different daily oil production rates.
The green column represents EBITDA at current daily production rate of 8,000 bbl/day; the orange column represents EBITDA at targeted daily production rate of 12,000 bbl/day; while the purple column represents EBITDA at maximum daily production rate of 20,000 bbl/day.
Even conservatively assuming increased estimated annual ITDA of RM 500m (FY20: RM 318m), and long-term average oil prices of $50 (FY20: $60), the estimated Net Profit and P/E ratio is potentially lucrative at daily oil production rates of 12,000 bbl/day and above.
2C Resources
Since we’re on the topic of improved daily oil production rate, it bears to pay in mind the relatively enormous potential from Hibiscus’s 2C Resources. North Sabah’s 2C Resources alone exceed 30 mmbbl; while those from the yet undiagnosed Marigold/Sunflower fields also reach 30 mmbbl. Altogether, 2C Resources exceed 70 mmbbl, which dwarfs the 44 mmbbl of 2P Reserves we have considered up to this point in our valuation estimates.
To refresh your memory, 2C Resources represents oil volumes which have been discovered but are not yet classified as “commercial”. This means that there is reasonable certainty of the oil being recoverable, as opposed to simply being in the very early stages of exploration. So, to be conservative, we will imagine that only 50% of 2C Resources are eligible for reclassification to 2P reserves, i.e. 35 mmbbl of oil.
This additional 35 mmbbl of oil represents an 80% increase to existing 2P reserves. Assuming the daily oil production rate increases similarly by 80%, we will arrive at 14,400 bbl/day of oil production. According to Table 2 above, this would yield an EBITDA of roughly RM 630m assuming $50 oil.
Comparing that estimated EBITDA to FY20’s actual EBITDA:
| FY20 | FY21 (incl. 2C) | Difference | |
| Daily oil production (bbl/day) | 8,626 | 14,400 | +66% |
| Average oil price (USD/bbl) | $68.57 | $50 | -27% |
| Average OPEX/bbl (USD) | $16.64 | $20 | +20% |
| EBITDA (RM ‘m) | 632 | 630 | - |
Hence, even conservatively assuming lower oil prices and higher OPEX/bbl (which should decrease in the presence of higher oil volumes) than last year, we get approximately the same EBITDA as FY20.
For the sake of completeness, let’s assume that Hibiscus issues twice the no. of existing shares over the next 10 years, effectively diluting shareholders by 50%. Even without accounting for the possibility of the acquisition of new oil fields, at the current market capitalization of RM 714m, the prospective P/E would be about 10x. Not too shabby.
Future oil prices exceeding $50 and effects from coronavirus dissipating
Hibiscus shares have recently been hit by a one-two punch from oil prices cratering from $60 to $30, as a result of both the Saudi-Russian dispute and depressed demand for oil due to coronavirus. This has massively increased supply and at the same time hugely depressed demand for oil (due to the globally coordinated lockdowns being implemented).
Given a long enough timeframe, I fully expect OPEC+ to come to an agreement and the economic effects from the coronavirus to dissipate, allowing oil prices to rebound. As we equity investors are aware, oil prices are cyclical and are bound to recover over the next 10 years.
When it does, valuations of O&G stocks (including Hibiscus’s) are likely to improve as investors overshoot expectations and begin to forecast higher oil prices into perpetuity, as they always tend to do in good times. When that time arrives, Hibiscus’s valuations are likely to become overoptimistic as all O&G stocks tend to do during oil upcycles, resulting in valuations far exceeding reasonable estimates of future earnings. If you can hold the shares up until then, it’s likely you will make much more on your investment than what we’ve been estimating.
