8.1 Introduction
The name of Ooi Teik Bee may be new to
some of you; he has actually established his reputation in Malaysia
stock market through the Yearly Stock Pick Competition, organized by
i3investor.com, and for topping the table a few years. In addition, he
has been working as a remisier for more than 25 years, and has survived
several devastating financial crises, and has helped his clients make
lots of money in Malaysia stock market.
Over the past seven years Ooi’s personal
investments have generated about 2,087% profit for his portfolio. The
returns on investment (ROI) of his portfolio over the past seven years
were mostly above 20%, except 2018. Below is the table of his portfolio
performance. Had anyone followed his stock selections closely, he or she
would have made a great fortune out of Ooi’s recommendations.
|
Year |
Annual Return |
Cumulative Return |
|
2013 |
+ 104% |
+ 104% |
|
2014 |
+ 61% |
+ 228% |
|
2015 |
+ 129% |
+ 652% |
|
2016 |
+ 22% |
+ 817% |
|
2017 |
+ 87% |
+ 1,615% |
|
2018 |
- 42% |
+ 895% |
|
2019 (as of Sep 19) |
+120% |
+ 2,087% |
Apart from providing stock
recommendations to his clients, Ooi also helps some of them manage their
funds. He had also helped Koon managing some of Koon’s money, about Rm
12 million, in 2016, for a year, and he generated about Rm 10 million
(or 83.33%) profit for the account Koon entrusted to him.
Some of you may be wondering why Koon let
Ooi manage his money whilst he has hit so many home runs and has made
so much money in stock investment. The answer is: for insurance
purposes. As we have learned earlier that no one is infallible. Koon
understands that, just like us, he can make mistakes too. Having Ooi to
manage to some of his money is actually of great help to him in
minimising loss and maximising gain. Whilst the investing philosophy of
Ooi may differ slightly from that of Koon, Ooi’s approach actually
provides a perfect complement to Koon’s method. That is why, even until
today, Koon always consults him before buying (and selling) shares. Ooi
will highlight red flags, threats which can jeopardise Koon’s
investments, offer his opinions, show Koon the charts patterns, and
support and resistance levels of the stocks, and point out the
overlooked areas, where special attention needs to be paid, before Koon
places his bets. In other words, Ooi is acting like Koon’s sounding
board.
Well, the main objective of this chapter
is not to promote Ooi’s service to you, nor to tell you how spectacular
his performance is, but to share with you his winning formula and
investing philosophy, which I hope will give you some ideas in selecting
stocks, to improve your strategy, and to help you make some money in
Malaysia stock market. Of course, if you also find it a sound investment
approach after reading this chapter, but are unable to practice it due
to your hectic work schedule, you may engage him to manage some of your
money.
8.2 What Makes Ooi So Successful?
The secret recipe of Ooi’s winning
investments is having a suitable stock selection and investing system,
which can help him make money consistently year after year and fits his
investment style, and his ability to follow the system religiously.
The system was developed and fine-tuned
based on his decades of experience in the stock market. Having survived
the three major market crashes enables him to build a robust investing
system, which does not only perform well in bull market, but remains
profitable in bear market. The model applies both technical and
fundamental analyses in picking stocks. Since the system requires
companies to pass technical analysis screening process followed by
fundamental analysis screening stage to be considered good stocks, those
counters selected using the system are not only uptrend stocks with
strong momentum, their financials are also fundamentally sound.
According to Ooi, the upside of stocks selected using this system is
greater than 50%, whereas their risk level is less then 10%. Thus, the
system creates plenty of positive asymmetrical risk reward opportunities
for him, and allows him to enjoy a higher overall return on investment.
The main drawback of the system,
compared to some other trading systems, is that it requires investors to
hold those stocks for three to six months. Sometimes it may go beyond
twelve months, depending on the price levels of the stocks and the paces
of their share price movement. Hour-to-hour and day-to-day price
fluctuations are usually ignored since investors using this system only
jump on the bandwagon when an uptrend starts, and close their positions
when the trend comes to an end. In addition, they find it difficult to
predict the movements of share price within a few hours, and to earn
enough to offset the trading commissions. That is the reason Ooi always
says Rome was not built in a day.
The second element of his winning streak
is his ability to follow the system religiously. It is not an easy task.
If doing it is so easy, everyone would have made a fortune in the stock
market after acquiring the investing rules and model. This is what
differentiates Ooi from average investors. Doing so usually requires
discipline, right temperament, positive attitude and hardwork. For
example, one must be patient to wait for the perfect breakout situation
to develop, be able to invest with conviction when the market is quiet,
and be willing to spend time studying the businesses of companies at
home when other people are having fun with their friends after office
hours.
8.3 First Screening Process: Technical Analysis
“For
me, technical analysis is like a thermometer. If you are a responsible
participant in the market, you always want to know where the market is –
whether it is hot and excitable, or cold and stagnant. You want to know
everything you can about the market to give you an edge.”
Bruce Kovner
Ooi always says “Human can lie, but charts don’t lie.”
One of the reasons that the information provided by charts is more
reliable than human’s words is that charts are the trails of money
movement. Chart patterns can only be formed when there are flows of
capital into and out of a stock. And he never takes any CEO’s words for
granted, as he knows the words coming out from CEO’s mouth are sometimes
not trustworthy, and The CEO can spin a story with which the trend does
not in sync. For example, the CEO can tell a very beautiful story of
the company’s business in front of journalists, whilst his/her family
members, friends and smart money are selling their shares aggressively
during the same period of time. When the share price of a stock declines
continuously that is a sign showing that the business is facing some
challenges or difficulties, and Ooi will immediately remove the stock
from his watch list. According to Jesse Livermore, “often
I have observed that the Chief Executive Officer of most companies is
little more than a cheerleader, who has only one job with regard to the
market. He must assure and reassure the shareholders that everything is
fine – if sales are down he tells the shareholders that the decline in
sales is nothing more than a slight problem due to some temporary
reason. If profits are down he assures the shareholders there is nothing
to worry about since the company has already reached and made adequate
plans to recapture their profitability.” That is the reason Ooi always says “Never trust anyone in stock market, trust yourself only.”
“Another
discipline I learned that helped me determine whether a stock would go
up or down is technical analysis. Drelles was very technically oriented,
and I was probably more receptive to technical analysis than anyone
else in the department. Even though Drelles was the boss, a lot of
people thought he was a kook because of all the chart books he kept.
However, I found that technical analysis could be very effective. I
never use valuation to time the market. I use liquidity considerations
and technical analysis for timing. Valuation only tells me how far the
market can go once a catalyst enters the picture to change the market
direction.”
Stanley Druckenmiller
In addition, chart patterns provide some
important information that cannot be obtained elsewhere. Very often
share price moves ahead of fundamentals. The reason is that there are
always some people who know the news of an important development ahead
of us. Paul Tudor Jones once said “The first thing I do is put my ear to the railroad tracks. I always believe that prices move first and fundamentals come second.”
Moreover, chart patterns reflect the behaviour of market participants.
These patterns will repeat over and over again. Experienced chartists
who are able to identify chart patterns and price trends, like Ooi,
definitely can take advantage of the skill to anticipate price movement
and time their entry and exit. That is why Ooi always says “Theory and practical are not the same in stock market…I am just interested in the trend and what the market wants,” and “it is not up to us to determine the market price, it is Mr Market.”
To him, it does not pay to argue with the market. Therefore, he always
gives priority to the signals given by chart patterns. His strategy is
to buy good stocks at the right time, not when they are near the bottom.
8.3.1 U = Uptrending stocks
“Big money is made in the stock
market by being on the right side of the major moves. The idea is to get
in harmony with the market. It’s suicidal to fight trends. They have a
higher probability of continuing than not.”
Martin Zweig
As we know downtrend stocks can continue
to go down. It can last a few months or a few years, and you will never
know for sure when reversal will occur. Even buying stocks in sideways
market will do you no good. The only way to ensure profitability is by
buying uptrending stocks. This is the reason Ooi insists on looking for
uptrending stocks in the first step of his screening process.
There are many ways to determine if a
stock is on an uptrend. One of the methods is to look for the stocks
with a rising price pattern, which shows a series of higher lows and
higher highs. In other words, the share price reaches a higher low level
and a higher high level than it did previously for a few times. Figure
8.3.1.1 and figure 8.3.1.2 show the pattern of higher lows and higher
highs.
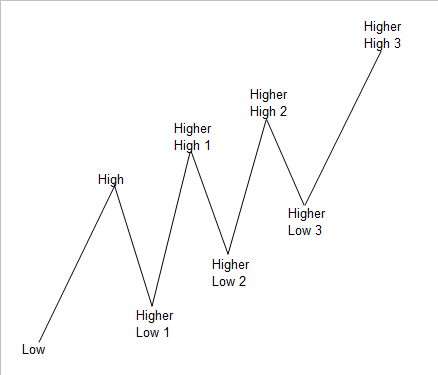
Figure 8.3.1.1: Higher lows and higher highs pattern
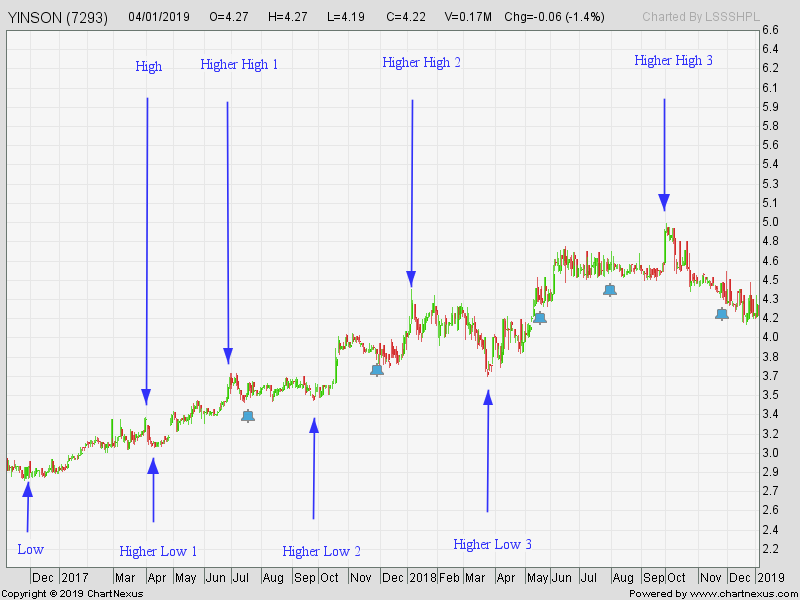
Figure 8.3.1.2: Share price of Yinson Holdings Berhad from December 2016 to January 2019
Source: ChartNexus
The second method is to find stocks with
more bullish/green/white candlesticks than bearish/red/black
candlesticks. According to Ooi’s observation, uptrend stocks tend to
have two to five bullish candlesticks and a short bearish candlestick.
Trade volume should be light during a healthy correction or decreasing
gradually during a pullback. Figure 8.3.1.3 shows the candlestick
pattern of Dayang Enterprise Holdings Berhad when the share price was on
an uptrend. It can be seen from the chart that there were more green
(bullish) candlesticks than red (bearish) candlesticks between early
February, 2019 and early-March, 2019, when its share price was on an
uptrend. Also, its trade volumes during corrections (or down days) were
lighter than those during up days.
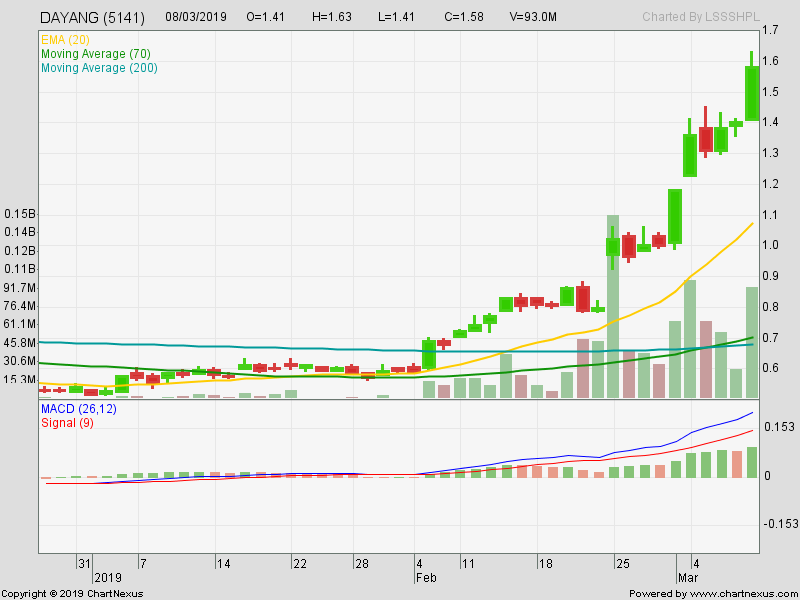
Figure 8.3.1.3: Share price of Dayang Enterprise Holdings Berhad from January 2019 to March 2019
Source: ChartNexus
The third method is to find stocks with
share prices above their 200-day Moving Average lines, and at the same
time their short-term Moving Average (MA) lines must be trending upward.
Take, Figure 8.3.1.3, for example, the share price of Dayang Enterprise
was in an upward movement when it crosses above 200-day moving average
line on 7 February 2019. At the same time, its 20-day EMA (yellow
coloured) line was also slopping up. Also, its share price was above its
20-day EMA line.
8.3.2 B = Breakout of resistance
“You should look for stocks making
new price highs as they break out of price consolidation areas (or
bases). Why? Because this is the point where most really big price
advance begins, and is the time where the probability of a significant
price move is the greatest.”
William O’Neil
The second step is to look for stocks
breaking out of a consolidation area, breaking out from a stable base,
or breaking above strong resistance. By doing so, investors do not have
to hold the stocks in sideways market, which are going nowhere, in their
portfolios for a very long period of time. According to Ooi’s
observation, Malaysian stocks trend upward and downward 30% of the time,
and go sideways 70% of the time. In term of risk-reward ratio, the
expected return is greater than the risk investors have to bear by
buying breakout stocks. Hence, the probability of making money is
higher. Keep in mind that when a stock breaks above its resistance
level, there must be a reason or an important development, which drives
its share price higher.
That said, you should not confuse
anticipating a breakout with buying after the breakout. In investing,
Ooi does not like to buy based on what he anticipates to happen in the
future, because no one knows when the breakout will happen, and there is
a likelihood that it may never happen at all. This is the reason why
Ooi insists on having the signal of a breakout from his system prior to
performing fundamental analysis and determining the intrinsic value of
the stock. Jesse Livermore once said “it’s
okay to mentally anticipate the action of the market, or a stock, but
take no action until the market has confirmed that you are correct, by
its action: Don’t anticipate market moves with your hard-earned cash.”
Also, Ooi will look at the trade volume
of the stock on the day of the breakout compared to its volume moving
average (VMA) line. The reason is that if the trade volume on the
breakout day is low, the breakout is more likely to be a fakeout or
false breakout. A breakout in low volume is generally a bad sign, as
buying interest, which breaks the resistance level, is not so great that
the stock may go into correction very soon after the breakout when
sellers come in to sell it down aggressively. That is why you should
look for stocks that break out in high volume.
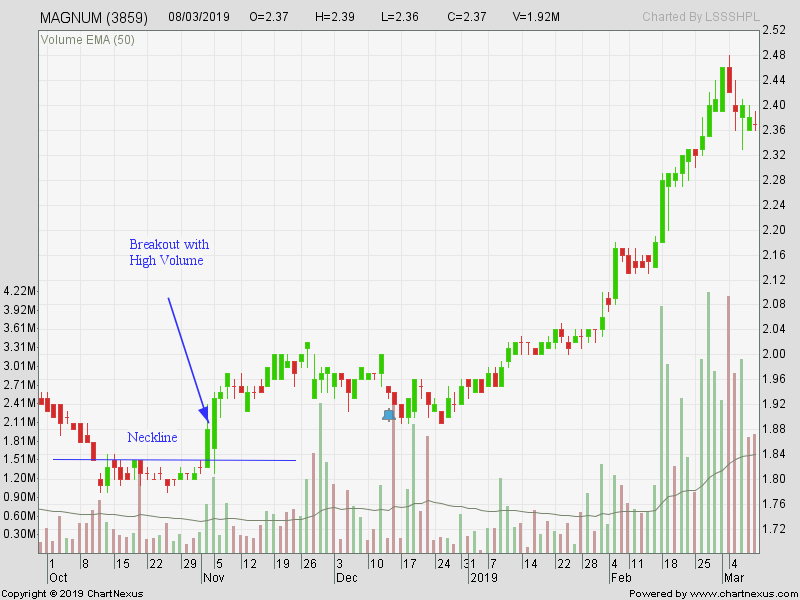
Figure 8.3.2.1: Share price of Magnum Berhad from October 2018 to March 2019
Source: ChartNexus
8.3.3 S = Sector in bullish mood
“In a bull market it is better to always work on the bull side; in a bear market, on the bear side.”
Charles Dow
In geography class, we learned that a
rising tide can lift all boats. A bullish sector is comparable to a
rising tide. If you want to select a stock that will go up in value, you
need to make sure that it is in a booming industry so that it can make
more money next year than this year. According to Bill O’Neil, “the majority of leading stocks are usually in leading industries.”
An investor can be safe in picking a
financially strong company, or company with a steady stream of cash
flow, but if he/she is wrong about the direction of the industry of the
stock, he/she would not make money in his/her investment. That is the
reason Ooi insists that the sectors of the stocks that he picks must be
in bullish mood. He will quickly sell the stocks when he senses that the
bear is around. And he will only come back when the bullish mood has
returned.
In 2015, even though FBMKLCI was heading
for a bear market, he advised his clients to buy V.S. Industry Berhad
at Rm 2.33/share, as the industry was still booming and the sentiment of
the industry was in a bullish mood. The stock eventually went up 904%.
He and his clients made a lot of money out of the investment. In 2017,
he went against the crowd again, and he advised his followers to buy the
shares of Hengyuan Refining Company Berhad. According to him,
Industry/Production Index continued to break new high in spite of the
declining FBMKLCI. He asked them to ignore FBMKLCI, as the stock they
bought into belongs to Industry/Production category, which was in
bullish mood. Again, he was right, and he made more than 100% profit out
of the bet.
The easiest way to judge if an industry
or a sector is in bullish mood is by examining the 200-day SMA line of
the industry or sector. The industry is considered to be in a bullish
mood if its reading is above 200-day SMA line, and vice versa.
8.4 Second Screening Process: Fundamental Analysis
“Stocks fluctuate together, but prices are controlled by values in the long run.”
Charles Dow
Despite calling himself a chartist, he
uses fundamental analysis in conjunction with technical analysis in his
stock selection process. For instance, even if the outcome of his
technical analysis on a stock indicates that its share price will be
moving upward, he would not place his bet until the outcome of his
fundamental analysis shows that the stock is worth buying. In this case,
fundamental analysis acts as a safety net, which provides a downside
protection for his venture, so that the risk of his portfolio is lowered
to the lowest possible level. In addition, it allows him to estimate
the upside potential of the investment, and to ensure that the
risk-reward is skewed to the upside prior to committing his money.
According to him, he only started to earn big money consistently in the
stock market after 2009, when he adopted both technical and fundamental
analyses in his stock screening/picking process.
Without further ado, let us take a look
at the important metrics of fundamental analysis that Ooi usually pays
attention to in his stock selection process.
8.4.1 G = Growth of profit greater than 10%
Bill O’Neil once said “There is absolutely no good reason for a stock to go anywhere in big, sustainable way if current earnings are poor.”
So, the key to making profitable investments is to ensure that stocks
in your portfolio are companies with growth, which are generating more
and more profit every quarter.
In order to do so, Ooi usually looks for
stocks with the growth of profit greater than 10% in his screening
process. Any stocks with profit growth rate lower than 10% will
automatically be weeded out from his watch list. The reason why he does
so is to select only proven stocks, which have delivered solid
performance continuously rather than risking his money unnecessarily in
some speculative stocks, which may tumble anytime when the market turns
bearish. Moreover, the growing profits are a good catalyst, which may
propel share prices upward when the market turns bullish.
There are two methods of searching for
companies with profit growth greater than 10%. The first method is by
comparing the annual profits of a company year-over-year (YoY). Let us
use the data provided in the table below, Table 8.4.1.1, for
illustration purpose. The annual profit of Company A in 2017 and 2018
were $410 and $463, respectively. In this case, the profit growth that
Company A achieved in 2018 was 12.93%. The second method is by comparing
the quarter profits of the same company year-over-year. For example,
Company A made $110 in Q4 Y17 and $122 in Q4 Y18. In this case, the
profit growth that Company A achieved in the Quarter 4 of 2018 was
10.91%.
|
Quarter |
Year 2017 |
Year 2018 |
Change |
|
Q1 |
$ 100 |
$ 113 |
+ 13.00% |
|
Q2 |
$ 95 |
$ 110 |
+ 15.79% |
|
Q3 |
$ 105 |
$ 118 |
+ 12.38% |
|
Q4 |
$ 110 |
$ 122 |
+ 10.91% |
|
Total |
$ 410 |
$ 463 |
+ 12.93% |
Table 8.4.1.1: Profits of Company A in 2017 and 2018
Whilst both methods can be used to
determine the profit growth of a company, the first method is more
suitable for use in judging the profit growth of defensive stocks, which
are mostly non-cyclical in nature, such as utilities companies, fast
food restaurants, non-durable goods producers, etc. The latter, on the
other hand, is more suitable for use in determining the profit growth of
cyclical stocks, such as oilfield services companies, semiconductor
manufacturers, property developers, and steel producers, as the changes
or improvements can be spotted easily and quickly.
Note: make sure that all non-recurring
items such as one-time profits or assets disposal gains are omitted from
the profits before making comparison.
8.4.2 M = Margin of Safety greater than 30%
“The concept of a margin of safety is
that an investor should purchase a security at a price sufficiently
below his estimate of its intrinsic value that he will have protection
against permanent loss even if his estimate proves somewhat optimistic.
An analogy is an investor standing on the 10th floor of a building,
waiting for an elevator to carry him to the lobby. The elevator door
opens. The investor notices that the elevator is rated for 600 pounds.
There already are two relatively obese men in the elevator. The
investor estimates their weights at about 200 pounds each. The investor
knows that he weighs 175 pounds. The investor should not enter the
elevator. There is an inadequate margin of safety. Maybe he
underestimated the weights of the two obese men. Maybe the elevator
company overestimated the strength of the elevator’s cable. The investor
waits for the next elevator. The door opens. There is one skinny lady
in the elevator. The investor says hello to the lady and enters the
elevator. On his ride to the lobby, he will enjoy a large margin of
safety.”
Ed Wachenheim
Unlike most traders, who pay no attention
to the intrinsic values of stocks yet aggressive, Ooi is cautious and
careful with all his investments. He always says, “It’s better to be safe than sorry.”
Whenever he invests his money in something, he makes sure that all his
purchase prices are 30% below their intrinsic values. His chance of
losing money, as such, is far lower than that of other people.
According to Investopedia, “Intrinsic value is the perceived or calculated value of an asset, an investment or a company.”
In other words, it is the inherent value of the business. Any purchase
price below this value is considered cheap. When share prices go far too
low, they tend to move back up to this level, as investors rush in to
scoop up the bargains. Hence, intrinsic value acts as a safety net to
value investors in their investments.
There are many methods to determine the
intrinsic value of a company. Some of the valuation methods Ooi uses
include EV-to-EBIT ratio of Magic Formula, Actual Return-to-Expected
Return ratio, Graham Number, Modified Graham Stock Valuation Formula,
and Discounted Cash Flow.
Method 1: EV-to-EBIT ratio (EV/EBIT)
Enterprise value to earnings before
interest and taxes (EV-to-EBIT or EV/EBIT) ratio is a form of valuation
method, very similar to Price-to-Earnings (P/E) ratio, used to compare
the relative value of different companies in the same industry and in
the market. But, this method takes both equity and debt into account in
the calculation, which is more comprehensive compared to P/E ratio.
According to Ooi, a company is
considered cheap if its EV/EBIT value is below 8, and deemed overvalued
if its EV/EBIT is higher than 12. Therefore, he always looks for
companies with EV/EBIT multiple lower than 8, and then set his price
target based on 12 times the EV/EBIT multiple.
Below is the formula of EV/EBIT

where
Market Cap = Share price × Number of shares,
EBIT = Net income + Interest + Taxes.
Method 2: Graham Number
Graham Number is a formula taught by
Benjamin Graham, through his book called Intelligent Investor. The
formula was developed to determine if a stock meets his requirements for
defensive play. The formula takes both book value per share (BVPS) and
earnings per share (EPS) data into account.
Below is the formula of Graham Number
 , where
EPS = Earnings / Number of shares
BVPS = Equity value / Number of Shares
When performing the screening work, Ooi
looks for stocks with share price 30% lower than their Graham Numbers.
For example, if the calculated Graham Number of a stock is $1.00/share,
Ooi would only give it a serious consideration if its share price is
lower than $0.70/share. The reason of doing so is to ensure that the
stock is undervalued, and the room for decline is small.
Method 3: Discounted Cash Flow (DCF)
Amongst the above-mentioned valuation
methods, Discounted Cash Flow (DCF) is the most popular one, as it takes
future cash flows into consideration. Financially stricken companies
with no ability to generate cash flow in the future will automatically
be weeded out during the screening process. The analysis requires
investors to estimate the present value of a stock based on its expected
future cash flows using a discount rate (required rate of return for
the riskiness of the cash flows).
For example, let us suppose that a fruit
seller offers to sell you his fruit shop for Rm 500,000. The business
can generate a fixed amount of Rm 100,000 cash flow stream every year
for 10 years, and your expected rate of return is 5%.
We can use the basic formula of DCF to
estimate the value of the business, and the formula of margin of safety
(MOS) to judge whether the shop is worth your money.
 , where
CF = Cash Flow,
r = required rate of return.

DCF = Rm 772,173
 , where
CP = Current Price,
IV = Intrinsic Value (or DCF in this case).

From the calculation, we can tell that
the business is worth Rm 772,173 and it is safe to buy the shop at Rm
500,000 from the fruit seller.
For experienced investors, if you want
to determine the precise value of business, you may use the advanced
formula of DCF, which includes terminal value, to estimate its value for
the first five years and beyond.
 , where
CF = Cash Flow,
r = Required rate of return,
WACC = Weighted Average Cost of Capital
g = Perpetual growth rate
 , where
E = Market capitalisation,
V = Total value of capital (equity and debt),
Re = Cost of equity,
D = Market value of debt,
Rd = Cost of debt,
T = Tax rate.
Re = Risk free rate of return + [Beta × (Market rate of return –
Risk free rate of return)]
Rd = (Risk free rate + Credit spread) × (1 – Tax rate)
8.4.3 F = Forecasted EPS is greater than current EPS
Ooi always says “We should look at future growth rather than historical growth
(of a company)” The reason is that the stock market’s mechanism, like
driving a vehicle, is a forward-looking mechanism. No one is able to
drive by looking at rear-view mirror. Similarly, investors will not be
able to make big money in the stock market by focusing on the historical
growth data of a company. The data can only be used as guidance, and
should not be used for estimating a company’s future value. Therefore,
investors must learn to forecast the future earnings of a company, so
that they always get themselves a head of the crowd.
In this process, Ooi looks for stocks
with forecasted earnings (or EPS) greater than their current earnings
(or EPS). New, hot and innovative products, superior services, change in
management practice, growing demand of products, changes in currency
exchange rate, pricing power, number of contract awards received and
growing market share are amongst the areas where Ooi always focuses on,
as they may bring higher revenue and profit to the companies.
For example, in 2015, after studying the
business of V.S. Industry Berhad (V.S.), he told his clients that the
earnings of V.S. would be growing exponentially, as the demand for
V.S.’s product was very high. Below are his opinions on V.S., which he
shared with his followers in 2015.
“V.S. has been supplying this coffee maker (GMCR) since the second half of 2014. It is the reason that the profit of Q1 2015 jumped up.”
“I believe this (GMCR)
is a fantastic company with explosive earning growth in 2015. Please
note that coffee consumption in the world grows 25% a year according to
BFM 89.9. (In term of coffee consumption,) USA ranks No. 5, Japan ranks No. 6, China ranks No. 7, and India ranks No. 8. It is a big market for the coffee maker.”
"As
long as there is no quality issue, GMCR will continue to order coffee
making machines from V.S., the future earnings would then be very high.
Hence, I can say V.S. is a fantastic company, and will be the star
performer of 2015. If the joint venture between GMCR and Coca-Cola works
well, the market is very big for this coffee maker."
He was right that V.S.’s earnings would be growing at a rapid rate, and he made nearly 800% profit out of this deal.
In the same year, he also recommended a
few export-related stocks such as Poh Huat and some furniture makers to
his clients, as he believed that weak Ringgit Malaysia would benefit
companies that export goods to the United States. Below is the extract
of his opinion, which he shared with his followers, on the future
earnings of export-related stocks.
“Look at the latest result of Pohuat. all export orientated stocks will do well because of the strong USD and weak RM.”
Again, he was right that the earnings of
export-related stocks would be growing. He and his followers made a lot
of money out of the investments.
Note that whilst high EPS and low PER
(or P/E) is a perfect combination, sometimes Ooi would pay a slightly
higher price for the profit growth potential if he believes that it is
worth paying more for the stocks. He once said “the
stock market is always forward looking, high PER does not mean this
stock cannot be a good buy. It is growth that matters most.”
The reason is that low PER stocks may get cheaper and cheaper if the
stocks have no growth potential, or the companies are in sunset
industries, or the businesses are going downhill. And, it seldom pays to
put your hard-earned money in this kind of stocks.
8.5 Other Technical Indicators and Signals Ooi Would Monitor
Other than the screening criteria
discussed above, Ooi also looks at several technical indicators for
signals to support his buy decisions. Sometimes when any of the
indicators shows that the time for hunting to is not ripe yet, he will
wait at the sideline until the time arrives.
8.5.1 MACD crosses above its signal line
Amongst the technical indicators we
discussed in Chapter 3, MACD is the most popular one, and is one of
Ooi’s favourite indicators. The indicator does not only help identifying
the direction of price trend, it also shows the momentum of the share
price’s movement, whether it is strengthened or weakened.
He prefers to buy stocks (in his watch
list) when their MACD lines cross above MACD Signal lines, especially
when the MACD lines are above the level of zero. When the MACD line of a
stock crosses above its MACD Signal line, it indicates that the stock
is turned bullish. When the MACD line of a stock is above its centreline
(or the level of zero), it shows that its fast-moving average (12-day
EMA) line is above its slow-moving average (26-day EMA) line and the
upside momentum is strong.
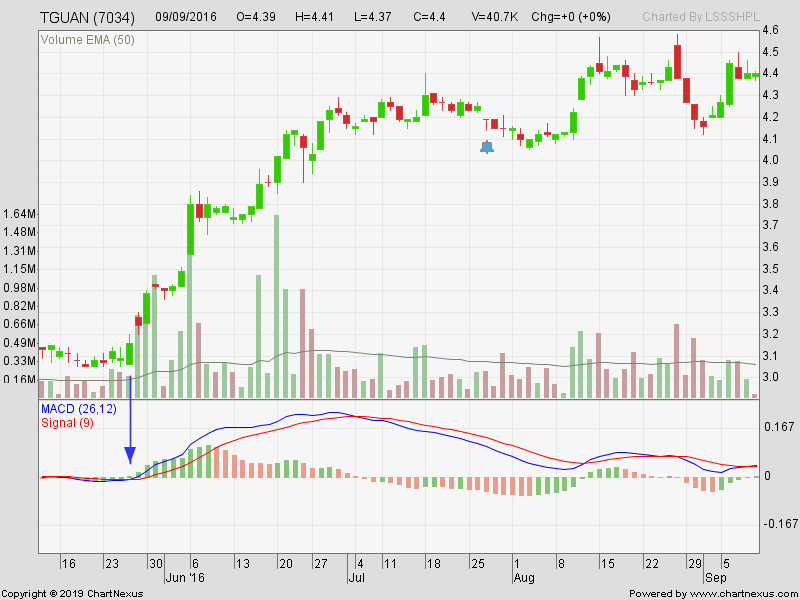 Figure 8.5.1.1: Share price of Thong Guan Industries Berhad from May 2016 to September 2016
Source: ChartNexus
Note that whilst he usually judges the
bullish level or bearish level of a stock based on its daily MACD
readings, sometimes, he would also look at its weekly MACD readings to
determine if the bullish level or bearish level of the stock is still
strong or weak.
8.5.2 Force Index colour changes from green to blue and the value is above zero
Whilst Relative Strength Index (RSI) is
more popular amongst traders, Ooi prefers Force Index (FI) over RSI. The
reason is that RSI will scare traders off when it is getting too high
(above the level of 80). It will indirectly deter them from buying
bullish stocks, especially when their prices are still shooting up like a
rocket.
FI uses price and volume to determine
the power of a price move. The stronger the share price move and the
higher the trade volume, the higher the FI reading is. As the indicator
takes volume into account, buying a stock when price breaks above its
resistance level with a high FI reading would give Ooi a higher chance
of making a winning bet and lower his probability of having a false
breakout.
Ooi likes to buy stocks in his watch
list when the FI reading of the stock changes from negative reading
(green colour or below zero) to positive reading (blue colour or above
zero). When the reading is above zero, it shows that the price upward
move is strong with high buying pressure.
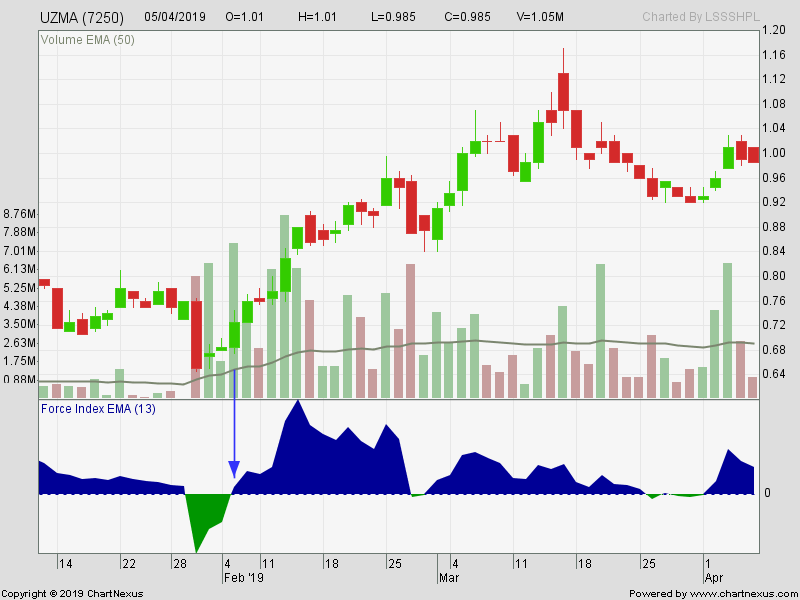
Figure 8.5.2.1: Share price of Uzma Berhad from Jan 2019 to April 2019
Source: ChartNexus
8.5.3 Stochastic Oscillator reading crosses above the level of 20
The indicator is usually used to
ascertain if a stock is overbought or oversold, and to determine the
momentum of price movement. A stock with Stochastic Oscillator reading
above the level of 80 is said to be overbought. When its Stochastic
Oscillator reading falls below the level of 20, the stock is considered
oversold, and everyone is in fear.
Stochastic Oscillator chart generally
contains two lines, namely %K and %D. % K is the current value of the
Stochastic indicator, whilst %D is the fast Stochastic indicator, which
is three-period moving average of %K. Investors can consider buying
stocks in their watch lists when their %K line crosses above %D in
oversold region, and when the %K crosses above the level of 20, as it is
a sign of reversal.
Stochastic Oscillator is another
favourite technical indicator of Ooi. He usually uses the indicator to
determine the reversal of a price trend. He prefers to buy a stock (in
his watch list) when its Stochastic Oscillator reading crosses above the
level of 20, which is moment when the oversold stock reverses and moves
upward.
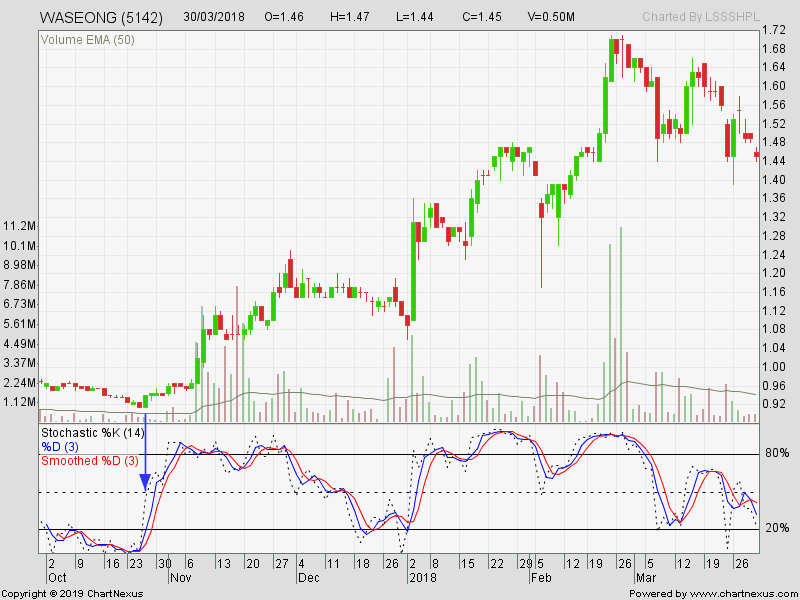
Figure 8.5.3.1: Share price of Wah Seong Corporation Berhad from October 2017 to March 2018
Source: ChartNexus
8.5.4 Price breaks above 20-day EMA line
20-day EMA is the average price of a
stock over the past twenty days, but places a greater weight to recent
data. When share price of a stock breaks above 20-day EMA line, it shows
that buying pressure is high, and buyers are willing to pay more to own
the stock for some reason.
When Ooi buys a stock, he prefers to
have the share price of the stock broken above its 20-day EMA line
before buying it. The reason is that when share price breaks above
20-day EMA line, its momentum is strong, and it is likely to go higher
and higher, which will indirectly reduce Ooi holding period of the
stock, and give him a higher rate of return.
Since his average holding period of an
investment is three to six months, the 20-period moving average fits his
investment time frame, as it is not too short and not too long. It
allows Ooi to stay in synchronisation with intermediate-term and primary
trends, yet capture the movement when a stock begins to move upward.
Note that in a volatile market, share price may fluctuate along the 20-day EMA line.
8.5.5 20-day EMA crosses above 70-day SMA (Golden Cross)
I know what you may be thinking right now
– have your finger on the buy button when the share price of a stock is
about to break above the 20-day EMA line and buy the stock before Ooi
builds his position. Wait a moment! That is not the only signal he looks
for before buying a stock. Sometimes, he would also wait for its 20-day
EMA crosses over 70-day SMA, which is also known as (intermediate-term)
Golden Cross, before buying it.
We have discussed in Chapter 3 that
Golden Cross is a bullish breakout signal, which is formed when
short-term moving average line crosses above long-term moving average
line. Share price is likely to begin its upward rally when Golden Cross
appears, as selling pressure has dried up, and buying pressure has
gained higher momentum. Additionally, it indicates a change in trend,
from either a sideways movement or a downtrend to an uptrend. Therefore,
using the indicator in trading will increase your chance of making
money. Also, the chance of having whipsaw trades, due to false signals,
will be greatly reduced, as the signal is generated by two smoothed
moving average lines.
According to Ooi “If
the trend (of a stock) is strong enough, the 20-day EMA will cross
above the 70-day SMA, and it is likely to continue its upward move.”
For inexperienced investors, who always try to pick the bottom and
ended up being trapped in sideways markets or downtrend stocks, the
Golden Cross signal (20-day EMA crosses above 70-day SMA) is a powerful
signal you should not ignore. The signal will ensure that your
investment is, more often than not, in a profitable position. The chance
of losing money in your investment will be reduced significantly.
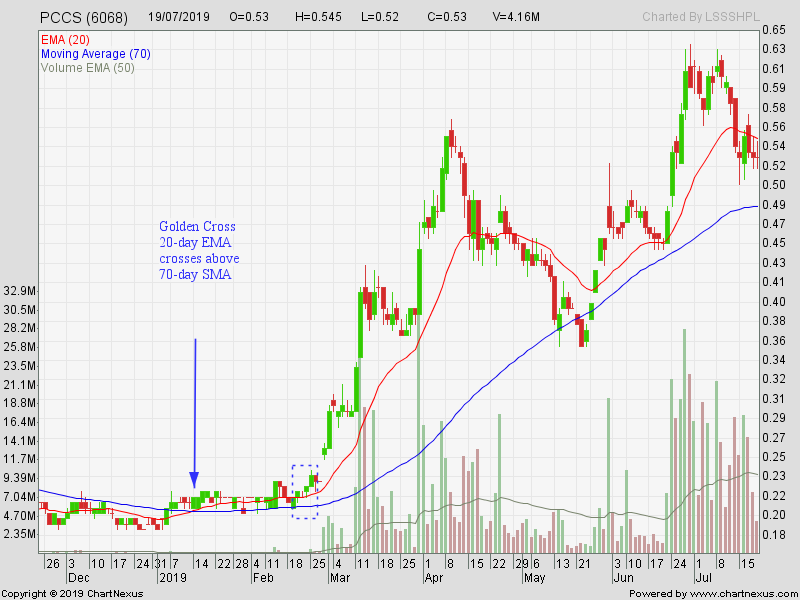
Figure 8.5.5.1: Share price of PCCS Group Berhad from December 2018 to July 2019
Source: ChartNexus
8.6 Buying Strategy
No wise trader and investor will buy a
stock at almost one price right at the beginning of the process with
only one approach. The risk of losing big is high if one dashes into the
stock market without testing the environment’s temperature, and trades
without a set of profitable strategies. Likewise, Ooi will not buy a
stock in large quantity at one price with only one strategy. From my
observation, he usually buys stocks in several orders at different
prices, and with different methods. Below are some of his favourite
buying strategies.
8.6.1 Buy on breakout
Ooi usually places his first order for a
stock when breakout happens. The breakout can be a breakout of a
congested zone, or a consolidation range, or a chart pattern. That is
the point where resistance line is broken with weak bears overwhelmed by
aggressive bulls.
The most common breakout pattern Ooi
looks for is cup-with-handle pattern. The reason Ooi likes the pattern
is that shaky hands are scared out and selling pressure will dry up
during the formation of the pattern. He would then start buying when the
resistance line of the cup-with-handle pattern (the right-hand side of
the handle) is breached. In addition, he emphasises on an increase of
volume during the breakout. The reason that a sharp increase of volume
is so important is that it shows strong interest from buyers.
Another breakout pattern Ooi would pay
attention to is breakout of range bound pattern, which is also known as
consolidation range. A consolidation range is a channel contained by
support and resistance lines, where share price moves up and down within
the range. Ooi would usually buy a stock that meets his selection
criteria when it breaks above the resistance level with high volume. The
reason is that the breakout gives him an opportunity to capture a
high-probability (major) upward price move at a very low downside risk.
When the upper barrier is crossed with high trading volume, share price
tends to move upward, as interest for the stock is so high that the
limited supply could not meet the demand of the market. In Chapter 3, we
have also learned that once share price breaks above the upper
boundary, the resistance line will become a support level, which helps
reducing the risk of losing money in the trade.
8.6.2 Buy near support level / buy on weakness
After his initial purchase of a stock, he
might consider buying more shares if his original purchase has shown
some profit, and if its share price still has plenty of room to grow. Of
course, the stock must be undervalued when he considers adding more to
his original position. He will buy it during a pullback (or short-term
correction) at an area where support is strong and trade volume is low.
In general, when the primary trend of a stock is rising, buying it
during a short-term pullback can be very rewarding.
I know you must be wondering why he insists on adding more only at support level or during a pullback. Well, according to Ooi, “Share
price cannot go up in a straight line, it needs a correction in order
to purge weak holders so that the price can go up further.”
Moreover, the retracement provides an opportunity for investors who
missed the train earlier on to buy at cheaper price before the
resumption of the uptrend. Therefore, when the price of a stock has run
up too fast, too high and too soon, he will not chase it. What he will
do is to wait for a reaction and buy on weakness when the market is not
too bullish. He tries to buy one tick above the support level. He always
says “Why would you pay more if you can get it at a lower price?”
In addition to the support line/zone
criteria, other factors he takes into consideration when determining if
he should still add more shares to his existing position during a
pullback includes
- Fibonacci retracement must be above 50% (on daily chart)
- Price does not break 3-month low (on daily chart)
- More blue-coloured (bullish) candlesticks than red-coloured (bearish) candlesticks over the last three months (on daily chart)
- Price must be above 20-week EMA (on weekly chart)
- No three consecutive red-coloured (bearish) candlesticks (on monthly chart)
8.7 Selling Strategies
In the previous section, we have learned
that knowing when to buy is important to protecting our capital, but it
is more crucial to know when to call it quits. This is the secret of
making big money in the stock markets, and it is particularly true for
investing in Malaysia market. Every successful investor knows the
importance of this theory and practices it religiously. Of course, Ooi
is of no exception.
To Ooi, investing in stocks is like
doing business. Shares are always regarded as merchandise. Therefore, he
does not keep them in a vault. He would sell them if the stocks are
deemed overpriced, or have no longer met his investing criteria. That
being said, he does not sell it at almost one price. He would sometimes
sell them when the stocks are still advancing, about to reverse, or have
gone up too fast. If he believes that the stocks fail to meet his
criteria, he would exit his positions immediately or even cut loss as
soon as he found out the problem. That is the reason he always says “buying stock is simple, but selling stock requires some skill.” Below are some of his selling strategies.
8.7.1 Sell partially when share price has gone up too fast
“Repeatedly, I have sold a stock
while it was still rising – and that has been one reason why I have held
onto my fortune. Many a time, I might have made a good deal more by
holding a stock, but I would also have been caught in the fall when the
price of the stock collapsed.”
Bernard Baruch
A wise investor will not allow greed to
dictate his/her decision-making process. When a stock is overbought, it
is probably a good time to realise some gain. Your cost will be lowered
when you cash in the profit. In addition, your exposure to market risk
will be reduced.
Ooi is very clear that his objective is
to make money in the stock market, and that he will not lose much money
for taking partial profit. Therefore, he would sell it into strength if a
stock has risen too fast or too soon. He would then buy it back during
correction if the uptrend is still intact.
The things he usually pays attention to are the movement of share price and trade volume. According to him “Stock price will correct after it hits 100% gain.”
The reason is that there is some emotionalism involved in the price
advance, and that smart money would have started to distribute their
shares to late comers. Therefore, he would begin to realise some gain if
any of his stocks has gone up too much from its base. Also, when the
advance of share price is far greater than forty-five degrees, or when
it spikes up, or has enormous move, it may be a time that he would to
take some profit off the table.
Of course, as a chartist, he also pays
attention to technical indicators. For example, he would prepare to sell
his shares partially if the stocks’ Relative Strength Indicator or
Stochastic Indicator is in the oversold territory for an extended period
of time, especially when the trend momentum has started to show a sign
of exhaustion. Also, he will look out for sell signals given by
Parabolic SAR, Force Index, and MACD indicators.
8.7.2 Exit completely when a stock fails to meet his investing criteria
Ooi always says “Buying shares must be slow, selling shares must be fast.”
If any of his stocks fails to meet his investing criteria, he would not
hesitate to sell it. When it happens, he will dispose the stock
immediately, even if the stock still seems strong.
“Sell
when there is an abundance of over-optimism. When everyone is bubbling
over with optimism and running around trying to get everyone else to
buy, they are fully invested. At this point, all they can do is talk.
They can’t push the market up anymore. It takes buying power to do that.”
Jack Dreyfus
For example, if the share price of a
stock has shot up too far above its intrinsic value, he would exit his
position quickly, as there is too much extremism involved in the price
advance. Of course, the share price may go up further, but we cannot
always sell at the highest price. It’s very difficult to predict the
market top. When the price of a stock is overshot to the upside, but its
earnings fail to catch up, it is highly likely that the price will
tumble as soon as the earnings report is released. Therefore, it is
better to sell before the stampede begins. There is a Wall Street adage
that says “Bulls make money and bears make money, but pigs get slaughtered.” The pigs are usually referred to those foolish people who dabble in the markets without knowing what is really going on.
Also, Ooi would exit his position if a
stock delivers two quarters of decreased earnings. In his reply to one
of his followers in mid-2015, he stated that “There is no growth (in Naim).
Hence I will not be interested in this stock. I selected it in early
2015 because its PER was low. The last two quarter (earnings) results
were not good, hence I avoid it now.”
The share price of Naim Holdings Berhad fell from Rm 2.50 (in mid-2015)
to Rm 0.80 (in 2019) after his disposal of Naim shares. If you are also
a follower of Koon, you should have learned from Koon that EPS (or
earnings) is the most powerful catalyst to move share price. When its
EPS (or earnings) goes up, the share price will also go up. Likewise,
when the EPS goes down, the share price will also go down. This is the
reason Ooi folds his cards immediately when a stock fails to produce two
quarters of increased earnings.
Further, Ooi will liquidate his position
when the share price of a stock crosses below its 200-day SMA and major
support line. Of all the moving average lines, 200-day SMA line is the
most powerful one. It acts as a strong support for an uptrend stock. If
the price of a stock reverses and crosses below the moving average line,
it signifies that supply is greater than demand, and a downtrend or
sideways market is likely to begin soon. You do not have to wait until
200-day SMA line turns down to sell your stock. You can do it
immediately once its share price crosses below the moving average line.
8.7.3 Cut loss when his initial purchase fails
“The
secret for winning in the stock market does not include being right all
the time. In fact, you should be able to win even if you are right only
half the time. The key is to lose the least amount of money possible
when you are wrong. I make it a rule never to lose more than a maximum
of 7% on any stock I buy. If a stock drops 7% below my purchase price, I
will automatically sell it at the market – no second-guessing, no
hesitation.”
William J. O’Neil
Ooi always says “There is no 100% sure win (investment) in the stock market.”
No matter how much due diligence we have performed in the early stage
of the investing process, we are not invulnerable to cognitive and
emotional biases, unpredictable bear attack, and any unforeseen matters.
Therefore, he is prepared to cut his losses short, always and without
hesitation, if any of his initial purchases turn out to be a bad one.
“Why
do most traders lose money? Because they would rather lose money than
admit they’re wrong. What is the ultimate rationalization of a trader in
a losing position? “I’ll get out when I’m even.” Why is getting out
even so important? Because it protects the ego. I became a winning
trader when I was able to say, “to hell with my ego, making money is
more important.”
Marty Schwartz
He always set his cut loss point and
criteria before he gets in. The reason of doing so is to have his
investments decision be made unemotionally, and be as objective as
possible. Pride and ego have no say whatsoever in his investment
decision making process. When share price falls below his cut-loss
point, he will press the brake immediately without arguing with the
market. He understands that when the trend goes against him, he must
fold his cards; there is no reward for arguing with the market.
“If you don’t bet, you can’t win. If you lose all your chips, you can’t bet.”
Larry Hite.
The reason that he cuts his losses early
is to prevent them getting too large to give him a nightmare. Every big
loss usually starts as a small loss, and then it grows bigger after a
while. When the share price of a stock starts falling, it may go lower
and lower, and no one knows how low it can go. That is why
superinvestors follow the rules of cutting their losses short and
letting their winners run religiously. They just have to take care of
the downside; the upside will take care of itself. Ooi once said “I
expect a few losses in my investments. As long as those losses are kept
at 10%, it is acceptable to me. It’s the overall return that counts. As
long as my winning probability is maintained at 70%, any small losses
won’t cause a significant damage to my portfolio.”
Below are some of the stop loss rules he always uses
1. Cut loss if price crosses below 20-week EMA (on weekly chart),
2. Cut loss if price drops below 200-day SMA (on daily chart),
3. Cut loss if price drops below 10% of the original purchase price,
4. Cut loss if there is no earnings growth (YoY) over last 2 quarters.
“I will often sell a stock if it
doesn’t go up shortly after I buy it. Even though it has not gone down,
if the stock doesn’t do what I expected it to do, that’s reason enough
to step aside and re-evaluate. When a stock you have bought falls below
your purchase price, it is telling you have made an error – at a minimum
in timing.”
Mark Minervini
Also, he would sell a stock, even at a
loss, if its share price does not move within three months. He does not
fall in love with any of his stocks. He believes that if a stock stays
put after some time, there must be something wrong with the stock. He
used the following metaphor to explain to his followers when being asked
why he sold his stock at a loss.
“Just imagine that your horse is injured, do you think it still can run and be the champion? The answer is no,” and “when one of its legs is injured, the horse will never be able to win a race. We should replace it with a better horse.”
8.8 Use Elliott Wave Principle to Determine the Direction of Price Action
In order to determine the position he is
in, and the direction of price action of his stock or the general
market, Ooi, more often than not, applies Elliott Wave Principle in his
analysis.
Elliott Wave is actually a share price
pattern theory developed by Ralph Nelson Elliott in mid-1930s. According
to Elliott, share prices of stocks usually move in certain repetitive
patterns like ocean waves. Formation of the waves is mainly due to
swings in investor’s emotion, psychology, or behaviour.
The patterns can be divided into two
main types, namely uptrend pattern and downtrend pattern. Each of the
trend patterns can be broken down into five waves, namely Wave 1, Wave
2, Wave 3, Wave 4, and Wave 5. The trend patterns usually begin with
Wave 1 and ends with Wave 5. Wave 1, Wave 3, and Wave 5 are impulsive
waves, whereas Wave 2 and Wave 4 are corrective waves. In general, the
corrective waves have three smaller waves, which are labelled as Wave A,
Wave B, and Wave C. That said, sometimes the correction may get
complicated, which would result in the formation of a flag pattern or
descending channel, pennant, or sideways consolidation pattern.
Therefore, you need to be flexible when analysing the pattern of a
trend.
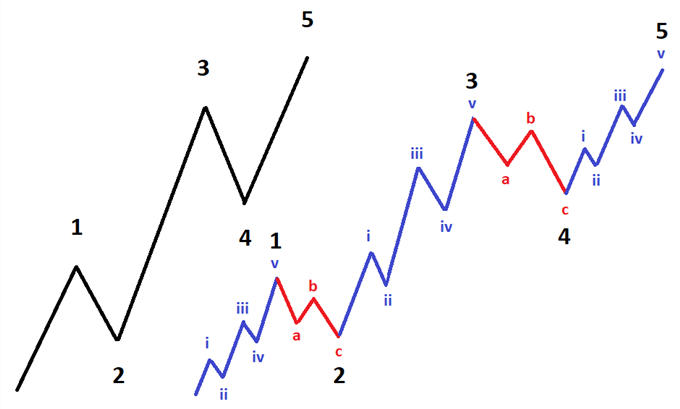
Figure 8.8.1: Elliott Wave pattern during bull market
Source: DailyFX https://www.dailyfx.com/forex/education/trading_tips/daily_trading_lesson/2018/12/26/depth-of-elliott-wave-correction.html
Figure 8.8.1 shows the normal Elliott
Wave pattern during a bull run. At the beginning of a new bull market,
the formation of Wave 1 is usually not very obvious, as the public and
media do not show much interest in the stock, except smart money. The
stock will subsequently experience a retracement, which is known as Wave
2. Note that the lowest point of Wave 2 must not be lower than the
lowest point of Wave 1. The percentage of the correction is generally
between 38.2% and 61.8% of Wave 1’s price difference. Depending on the
situation of supply and demand, sometimes the retracement may be lower
than 38.2% of Wave 1, and other times it may be higher than 61.8% of
Wave 1, but it will not exceed 100% of Wave 1.
After the brief pullback, the stock will
advance again. This impulsive wave is known as Wave 3, and is the
strongest move amongst the three impulsive waves. The price difference
of Wave 3 is generally 61.8% higher than that of Wave 1. Therefore, the
highest point of Wave 3 is always above the highest point of Wave 1.
During this time, a lot of sell-side analysts will begin to cover the
stock and you will also see some talking heads discussing about the
company’s business and earning prospect. Therefore, the trade volume in
Wave 3 will increase significantly, and is the highest one amongst the 5
waves.
Koon always says no stock can go up
continuously in a straight line for whatever reason, after a while it
must come down (either retrace or reverse). Wave 3 is usually followed
by Wave 4, which is corrective wave. The percentage of the retracement
is generally between 38.2% and 61.8% of Wave 3’s price difference.
Again, depending on the situation of supply and demand, sometimes the
retracement may go beyond the range of 38.2% and 61.8%, but it will
never be more than 76.4% of Wave 3. The next wave is Wave 5, which is
also the final wave of an uptrend pattern. The length of Wave 5 is
generally between 61.8% and 100% of Wave 3’s length. That said, the
length of Wave 5 may sometimes exceed 100% of Wave 3, if there are too
much supply of money, and if the market shows overconfidence in the
stock, but it is always shorter than 161.8% of Wave 3’s length. In
comparison, the trade volume in Wave 5 is lower than that in Wave 3.
This will result in a bearish divergence, rising prices with declining
volumes. During this time, the shares of smart money have almost been
distributed to those late comers, and the trend is about to reverse
soon.
Note that the ratios of 14.6%, 23.6%,
38.2%%, 50.0%, 61.8%, 76.4%, 85.4% and 100.0% are called Fibonacci
ratios, which are discovered by Leonardo Fibonacci da Pisa in the 13th
century. Elliott noticed the relationship between Fibonacci ratios,
wave length, and mass psychology, and he recognised the importance of
Fibonacci ratios when he studied the patterns of those waves. Therefore,
he integrated the ratios into his Wave principle.
By arming himself with the knowledge of
Elliott Wave Theory, Ooi can tell the direction of a stock or the
market, where the price of a stock or the market is likely to go, and
devise suitable strategies to capitalise on the price trend to maximise
his return.
8.9 Investing Principles
You can have the above-mentioned stock
selection criteria coded into your algorithmic trading system, and let
your computer and smart-phone trade for you, but you would not be able
to emulate the performance of Ooi if you do not understand his investing
principles. It is the guiding principles, which Ooi spent a few decades
to develop, influence the outcome of his investments. Therefore, we
must also study the investing principles of Ooi in order to understand
how he makes his investment decisions, and how he achieves the striking
performance.
“If the investment game were all about numbers and calculations, then,
in theory, given the computer programs available these days, you should
be able to punch in the right criteria and make money all the time. It
doesn’t work that way.”
Thomas Kahn
8.9.1 Avoid stocks in downtrend market
According to Business Dictionary, downtrend is defined as “Sustained downward movement in the price of an item or trading activity in an economy.” The main cause is that the selling pressure of the item is greater than its buying pressure.
When a stock slides downward, there must
be a good reason for the decline, and no one knows when the trend will
reverse. There is a high possibility that the price may never return to
your original purchase price. Therefore, Ooi always advises his clients
to stay at the sidelines instead of pounding their hard-earned money
down the rat hole when a stock is on a downtrend.
Whilst some “Kamikaze Warriors” believes
falling knives very often beat the market by a wide margin, and
consider catching the knives a rewarding attempt if done carefully, Ooi
does not like the idea of buying shares when uncertainty is still high.
He would rather wait for the dust to settle down before making any
investment decisions on the counters.
8.9.2 Other metrics he would study
“It’s much easier to stay out of trouble now than to get out of trouble later.”
Warren Buffett.
Other than the main metrics of
fundamental analysis discussed earlier, sometimes Ooi would also analyse
the ability of a company in servicing its debt. In the world of
business, debt is not a bad thing. Debt offers organisations plenty of
benefits, which include but are not limited to investment and expansion
opportunities, low financing cost, capital for day-to-day operation,
lower taxable income, if people know how to tame the monster. Failure to
manage it properly, on the other hand, will drag their stocks down and
give investors a lot of troubles. Therefore, Ooi would examine the cash
flow record of a company and its debt-to-equity ratio level, interest
cost, net debt and liquidity ratio, in order to get a better picture of
the company’s financial health before trusting his money to its
management.
Also, Ooi would study the Return on
Equity (ROE) and Return on Invested Capital (ROIC) of the company in
order to assess the efficiency of the management in managing their
capital and assets. The higher the figures, the higher the management’s
efficiency is in allocating their resources. He prefers to buy highly
efficient companies, which are able to produce ROE and ROIC higher than
10% and 12%, respectively. Of course, this is just a guideline and is
not a hard-and-fast rule to determine if a stock is a good buy.
Sometimes, he would purchase a stock even though its ROE and ROIC do not
meet his target (i.e. stocks in cyclical industries) if he believes
that the company’s business is booming, and is generating higher and
higher cash flow.
8.9.3 Hardwork, hardwork, and hardwork
“The only way to gain an edge is through long and hard work.”
Li Lu
“If you don’t work very hard, it is extremely unlikely that you will be a good trader.”
Bruce Kovner
If you want to know the secret of Ooi
making so much money in the stock market, the answer is hardwork.
Hardworking may also be the best word to describe about him. He is a
hardwork believer. He always says hard work beats talent. He told his
followers that “I work 12 hours a day everyday on (studying) KLSE
stocks alone, including weekend. Investing is what I am most passionate
about. I do not want to miss any of the precious opportunities. I came
from a very poor family, and earning money is very important to me. I
also do not want my clients to lose money and opportunities,” and “writing
the Weekly Market Outlook Report alone would take me more than 5 hours.
I need to spend the whole Saturday or Sunday morning, locked inside my
private room, to write it without anyone to disturb me. I treasure my
reputation. I want to ensure that my report is value for (my clients’) money. It takes a lot of hard work and sacrifice. I hope all my subscribers will get the best out of me.” Also, he always says he could not sleep well if his clients lose money. That is why he works so hard.
Another reason he works so hard is that
he wanted to learn more and to improve his performance constantly.
According to him, his made many mistakes during the 1997 Asian Financial
Crisis, which nearly wiped him out. But it did not deter him from
climbing back up. Quite the opposite, it lays the groundwork for him to
improve his investing system further. Even though he is very successful
today in investing, he continues to work hard so that he will not repeat
those deadly mistakes.
Sometimes Ooi will read articles, and
information provided by other people, but he will do the analysis, go
through his checklist and study all parameters of the stocks, and make
judgement himself. He always tells his followers “You can listen to tips, (but) you must do your homework before you buy. It is your hard-earned money.”
Indeed, there’s no such thing as a free lunch. People, who listen to
tips, take things for granted without performing their own obligatory
due diligence always wind up losing money in the market. According to
Jesse Livermore, “In speculation and
investment, success comes only to those who work for it. No one is
going to hand you a lot of money… If there was any easy money lying
around, no one would be forcing it into your pocket.” He also said that “Tips
come from many sources – from a relative, a loved one, a pal who had
just made a serious investment himself and want to pass on his expected
good fortune. They also come from hucksters and criminals… often
misleading articles are planted by people or brokers with hidden
agendas, who want to sell their stock on the good news or they want to
keep people invested while they go ahead and distribute their own stock.”
8.9.4 Only buy stocks with high market liquidity
High liquidity is particularly essential
to Ooi, who relies on both fundamentals and charts to make his buy and
sell decisions. If the trend or the fundamental of a stock has changed
unexpectedly, he must buy or dispose it immediately. Therefore, he needs
the high liquidity nature of stock to get in and get out quickly, so
that he does not lose money in the investment.
Unlike small investors, who can buy and
sell a stock easily without causing a significant move in its share
price, Ooi has a large sum of money under his management. Each time when
he wants to buy and to sell his stock, he will have some difficulty
building and closing his position if the market liquidity of the stock
is low. For example, if the liquidity of a stock is low, he would have
difficulty finding buyers without lowering his asking price when he
sells the stock. Also, when he sells a stock, its share price will fall
continuously. By the time he disposes all his shares, the price will be
very low, and his average selling price will be reduced greatly. Hence,
before buying a stock, he also looks at the record of its trade volume.
If the liquidity is low, he would rather give it a miss. In 2017, he
told one of his friends that “Superlon
passed my stock selection criteria. The only problem is the volume is
too thin. I have many followers, it is difficult to get out when we want
to sell.” In that case, he could only watch the opportunity slipped through his fingers.
8.9.5 Patience is extremely important
“The big money is made by the sitting
and the waiting – not the thinking. Wait until all the factors are in
your favour before making a trade – follow the Top Down Trading rules.
Once a position is taken the next difficult task is to be patient and
wait for the move to play out.”
Jesse Livermore
In the previous chapter, we have learned
that being patient is extremely important in investing. That is why Ooi
always advises his followers to be patient. When the market sentiment
turns bearish, he will advise them to close out their position, and when
there is no opportunity to invest, he will ask them to wait at the
sideline. According to Jack Schwager, investing and trading is likened
to playing poker, “You don’t just play every hand and stay through
every card, because if you do, you will have a much higher probability
of losing. You should play the good hands, and drop out of the poor
hands, forfeiting the ante. When more of the cards are on the table and
you have a very strong hand – in other words, when you feel the
percentages are skewed in your favour – you raise and play that hand to
the hilt.”
“We do a lot of thinking and not a lot of acting. A lot of investors do a lot of acting, and not a lot of thinking.”
Lou Simpson
After buying a stock, Ooi will hold it,
and wait for three to six months. And he always advises his followers to
avoid getting in to and out of the market every day, and to avoid
taking profit too early. When they trade too often, they do not only pay
hefty amount of money in commission to their brokers, they also miss
the opportunity to make big money when the stock moves upward in a
significant way. Moreover, when they take profit too early, they give
the opportunity for their skilled counterparts to capture the large
chunk of profit. That is why Ooi says “The best thing to do is to avoid watching share price everyday.” William Eckhardt once said, “One
common adage on this subject that is completely wrongheaded is: you
can’t go broke taking profits. That is precisely how many traders do go
broke. While amateurs go broke by taking large losses, professionals go
broke by taking small profits. The problem in a nutshell is that human
nature does not operate to maximise gain but rather to maximise chance
of gain. The desire to maximise the number of winning trades (or
minimise the number of losing trades) works against the trader. The
success rate of trades is the least important performance statistic and
may even be inversely related to performance.”
8.9.6 Keep an open mind
“Those who stop learning get passed by.”
Whitney Tilson
“Those who cannot adjust to change will be swept aside by it. Those who recognize change and react accordingly will benefit.”
Jim Rogers
Whilst he possesses a set of rules to
guide him in investing, Ooi understands that in order to stay profitable
in the ever-changing market, he must evolve constantly. Therefore, he
always keeps his mind open to new ideas, concepts, theories, and
developments, and learns as many different investing strategies as he
possibly can. He does not mind to learn from other young investors who
have some special skills in investing, be it in value investing,
momentum investing, income investing, dollar-cost averaging investing,
growth investing, small-cap investing or socially responsible investing.
He would study each of the investing methods and integrate the some of
principles into his own approach. He always tells his followers “You
need multiple skills to win big in stock markets. Please do not confine
yourself to a single skill. Just like playing basketball, you must be
able to shoot with your left hand as well as your right hand. I don’t
care if the cat is black or white, so long as it catches mice.”
8.9.7 Use leverage to maximise gain
Despite being a prudent investor, Ooi
understands that being too conservative will do no good to his
investments. He tries to increase his gain when he is right and minimise
his loss when he is wrong. Therefore, he would sometimes use leverage,
such as margin loan and warrants, to maximise his overall return if he
believes that the risk-reward ratio of his targets is skewed to the
upside.
Whilst some investors believe that using
margin finance adds unnecessary extra risk to their existing
investments, and advise their peers to avoid it like the plague, Ooi
thinks otherwise. According to him, using margin finance does not equate
to getting a death sentence. It depends on the skills and discipline of
an investor. He usually takes margin loan to invest when the market
sentiment is bullish and will stop using it completely if the sentiment
turns bearish. He limits his borrow to 50% of the purchase price of his
marginable investments. Margin financing has helped him made a lot of
money in the stock market. Therefore, he always says “There
is nothing wrong to use margin financing provided that you are
proficient in using it. I have been using it for 25 years, and I am
still in a financially sound position. But I don’t encourage investors
to use margin finance if they do not have the necessary skills.”
Below is his advice for people who consider using margin finance in their investments. “Look
at your trading history in last 5 years. If you are in a winning
position, then you are qualified to use it. If you are still in a losing
position, you are not encouraged to use it. Margin finance is like a
machine gun, if you have the skill to use it, it is a very useful and
effective tool. If you do not have the special skill to handle it, it
will kill you and your love ones. Please learn the special skill and you
must prove to yourself that you can make money from stock market
consistently year after year before using it. Note that you cannot use
margin finance in a bearish market, you will end up with a big loss. So,
never use margin finance if the overall market is bearish. Use it only
in bull market to maximize your gain. In addition, you should use margin
finance for a short period of time only, and you should not keep your
share under margin financing for 365 days. My advice is to avoid keeping
your shares in margin account for more than three months. You must be
disciplined if you want to use margin finance. If you do not have a good
money management skill, please avoid using margin financing. Also, if
margin of safety of your stock is less than 30%, you should not use
margin loan for the stock.”
Other than using margin loan, Ooi also
trades warrants to maximise his return. When he buys warrants, he will
look at the values of the warrants. According to his study, “A
warrant trading at a discount is one that nobody is interested in. In
general, a warrant is ‘in the money’ when the stock it attached to is on
a downtrend. Most of the times, no one is interested in the stock and
warrant for a reason that we do not know.” Therefore,
he tries to shun those warrants trading at a discount to their
underlying values and look for those trading at a premium to their
stocks. In one of his replies to one of his follower, he said “I
do not care much about dividend, I aim for capital gain. Dividend is
only a bonus to me. Generally, I like warrants trading at a premium; I
do not like warrants trading at a discount. Warrants trading at a
premium, most of the time, are the warrants with an uptrending stock and
the stock must be very bullish.”
8.10 A card up his sleeve - WuXing Theory and BaZi Astrology
Other than applying fundamental analysis
and technical analysis, and having the ability to control his emotions
and maintain discipline, Ooi also capitalises on his Chinese Astrology
knowledge such as WuXing theory (the five basic elements: metal, water,
wood, fire, and earth) and BaZi (the four pillars of destiny) to
determine the most suitable periods of time and the best areas, when and
where he should make his investments, in order to increase his chance
of making winning bets.
According to WuXing theory, the five
elements – metal, water, wood, fire, and earth – will interact with each
other when they come in contact together. Two predominant effects
produced by them are generating and overcoming effects. For example,
water will nourish wood when rain water falls on plants, but it will
extinguish fire when they come in contact together. The diagram below
depicts how they interact with other elements and the impacts these
elements will cause when they come in contact together.
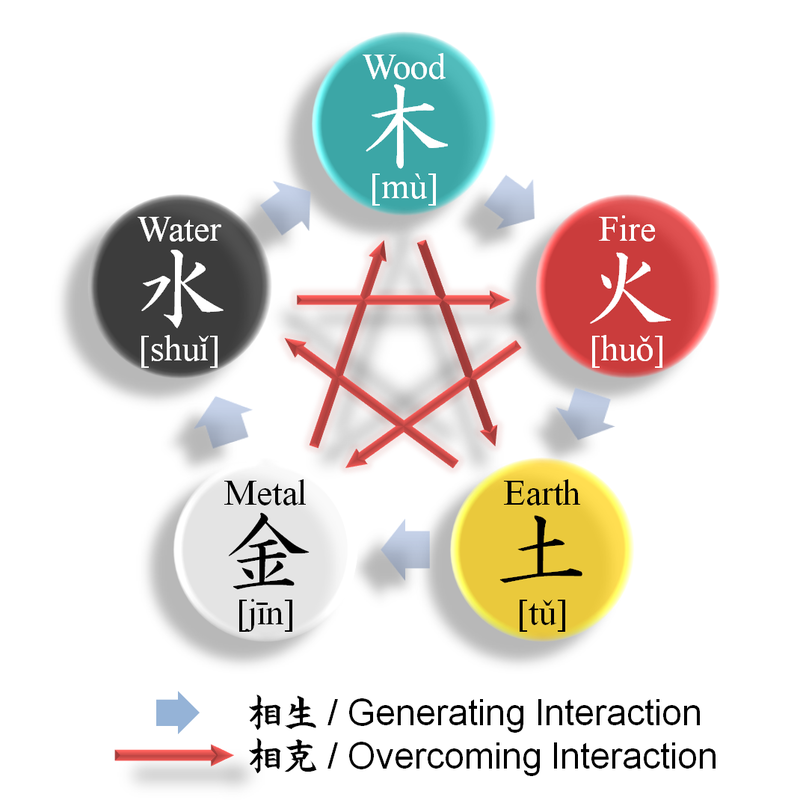
Figure 8.10.1: Five elements chart
Source: Wikipedia https://en.wikipedia.org/wiki/Wuxing_(Chinese_philosophy)
Before Chinese New Year, Ooi would
usually study Chinese Lunar Calendar, which is also known as JiaZi
Calendar, to find out to which element the following year belongs and to
which element each month in the year belongs. The objective of this
study is to choose some suitable sectors, which are more likely to
perform in the year or in certain months, for his investments in that
particular year, and to determine which stocks should be removed from
his portfolio.
Other than WuXing theory, he also
studies his BaZi to find out his own destiny. By understanding his own
potential, he can deploy his strategy wisely. Just like a cyclical
business, every one of us will experience the inevitable ups and downs
in life. Ooi believes that if he could reduce his losses to the lowest
possible level in his down years, and maximise his returns with the use
of leverage during good times, he would be able to amass a huge fortune
in investment in his life.
|
||
|
