Weekly Time Frame
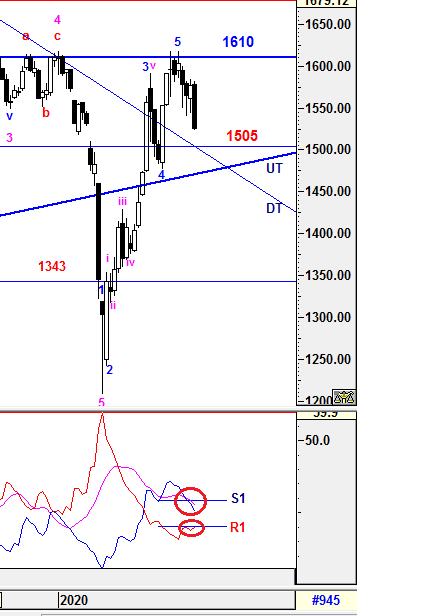
Once again 1572 was failed to hold and KLCI closed sharply lower at 1525.21 after 1540 broken further. Caution is still required when rebound take place until further clearer signal to justify the trend reversal.
On other hand, the higher degree of correction will be elaborated further in daily time frame.
-DMI (red line) is curving up indicates bearish momentum is in favor with resistance at point R1 which may provide some short term halt in bear mode otherwise bear may continue to emerge if R1 breakout. +DMI (blue line) is continuing heading down with greater margin exponentially and broke below support S1 indicates the pace of bull strenght is continuing decrease. ADX (pink line)
is curving down which implying the volatility of the current bull trend
is still uncertain in shorter term. Therefore, the summations of the 3
signals above is implying uncertainty still remains and knee jerk reaction is unavoidable as expected.
Prevailing trend could be emerged if weekly levels listed below was broken:
Resistance - 1610
Immediate Resistance - 1553, 1560-1580
Immediate Support - 1520
Support - 1505,1485,1475 (UT line)
Daily Time Frame
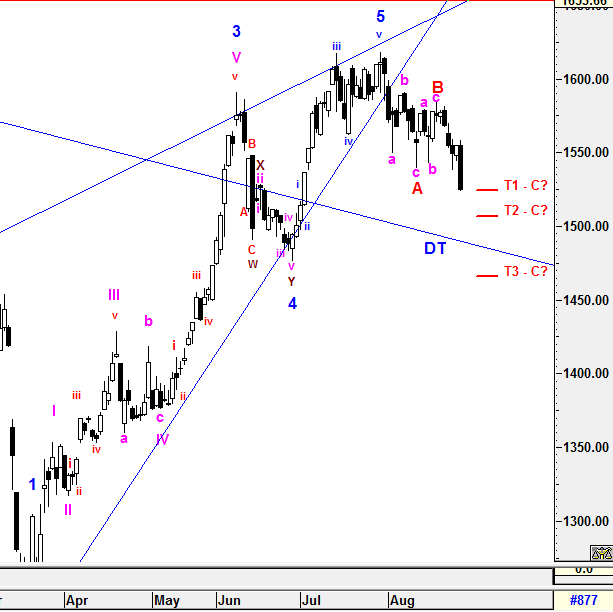
Due to magnitude of the momentum, there
are acceptable threshole allowances to fit or qualify the wave counts
criteria. No doubt that wave B was formed at 1584.36 (almost 61.8%) which had qualified the minimum criteria of wave counts with 3 sub minutte waves "abc" formation.
To recap, each wave A and B were formed with 3 sub minutte waves "abc" and currently wave C is being constructed with possible regular 5 sub minutte waves (Zig Zag Formation) OR 3 sub minutte waves (Complex waves such as WXY).
Therefore, there would be 3 possible target of wave C as below:
T1) 1536.26 (61.8%)
T2) 1506.31 (100%) - Marginally above DT line
T3) 1457.85 - 1465 (apx 1.618%) - lowest level to validate the entire Super Bull Cycle.
From these 3 target level above, KLCI had already met and crossed beyond the minimum criteria of target (T1). Therefore, the type of the entire correction formation will be monitored closely as wave C has the most properties of wave forms which may lead to complexity formations and may end in between the range of T1 - T3 stated above based on magnitude of the momentum with valid signal.
All waves' count and projected target
are generated based on past/current price level and it may be subjected
to vary if degree of momentum movement change.
Prevailing trend could be emerged if daily levels listed below was broken:
Resistance - 1580, 1610
Immediate resistance - 1536, 1550
Immediate support - 1503, 1514
Support - 1490 (DT line)
Let's Mr Market pave the waves to a healthy Super Bull Cycle.
Trade safely
Wave Believer
https://klse.i3investor.com/blogs/E_Wave/2020-08-29-story-h1512602182-KLCI_waves_22_Wave_C_Emerged_and_Ended.jsp
https://klse.i3investor.com/blogs/E_Wave/2020-08-29-story-h1512602182-KLCI_waves_22_Wave_C_Emerged_and_Ended.jsp
