Historical data may not be 100% accurate and indentical representative but it helps to provide a benchmark reference on future projection. One of the key indicator benchmark on the gold price performance is the USD Index as it always reacting to each other directly.
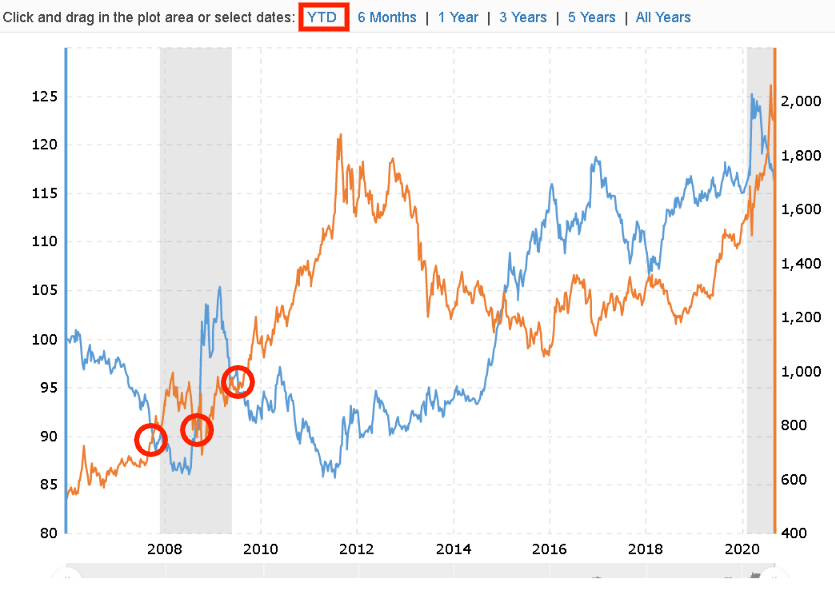
Here is the chart from before 2008 Sub-prime crisis crash, do note the following
1) 3 crossing points of both Gold Price & USD Index.
2) From first cross to 3rd cross take about 2 years
3) After the 3rd intercross, the gold price shoot to record high while USD dropped to record low.
Here is the chart of last 6 months of 2020 showing similar trends where both Gold Price & USD Index as follows
1) 3 intercrossing has already presented and both Gold Price & USD Index started departing in opposite direction.
2) The first cross to 3rd cross take only 4 months as compared to 2008 where it took 2 years.
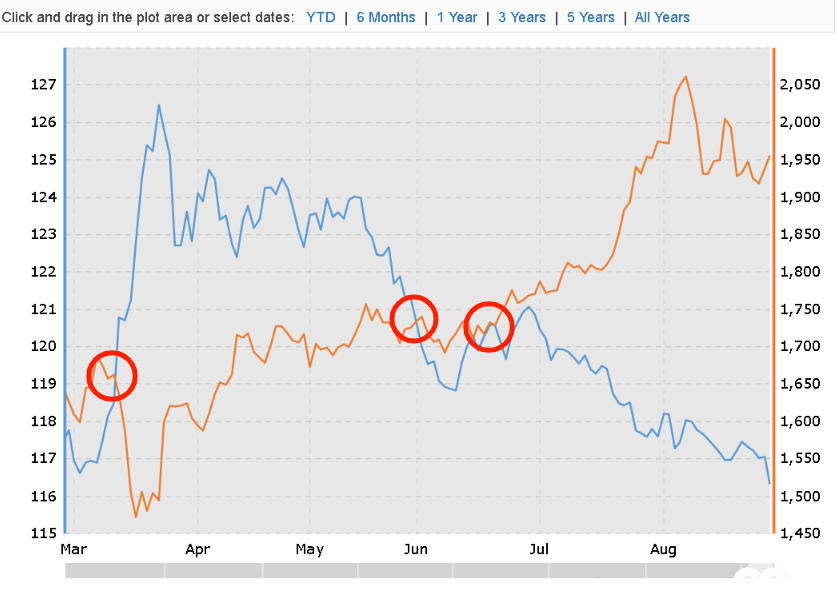
By comparing both charts, it reflected the fast track of the impending Gold Price explode owing to the uncertainty from Covid19, Global Recession, US Election & US-VS-China.
https://klse.i3investor.com/blogs/GOLDRUSH/2020-09-04-story-h1513318097-Gold_Price_Vs_USD_Index_Impending_Explode.jsp
Here is the chart from before 2008 Sub-prime crisis crash, do note the following
1) 3 crossing points of both Gold Price & USD Index.
2) From first cross to 3rd cross take about 2 years
3) After the 3rd intercross, the gold price shoot to record high while USD dropped to record low.
Here is the chart of last 6 months of 2020 showing similar trends where both Gold Price & USD Index as follows
1) 3 intercrossing has already presented and both Gold Price & USD Index started departing in opposite direction.
2) The first cross to 3rd cross take only 4 months as compared to 2008 where it took 2 years.
By comparing both charts, it reflected the fast track of the impending Gold Price explode owing to the uncertainty from Covid19, Global Recession, US Election & US-VS-China.
https://klse.i3investor.com/blogs/GOLDRUSH/2020-09-04-story-h1513318097-Gold_Price_Vs_USD_Index_Impending_Explode.jsp
