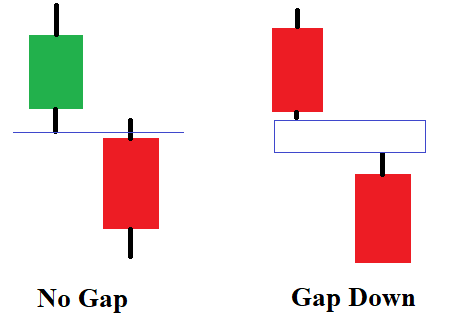
We have two types of gaps when we are watching a graph, which are gap up and gap down, so what are they? Gap up means that the lowest price today is even higher than the highest point yesterday. For example, the lowest price today is RM1, but the highest price for yesterday is RM0.95.
Gap down is the complete opposite, where the highest point today is even lower than the lowest price for yesterday. For instance, today highest is RM1, but the lowest price for yesterday was RM1.05.
So after the price between two days has a gap, it will only most likely form a window. The window will act as your resistance or support area. We normally only use support or resistance line, but window is a more powerful version of those, as it is an area.
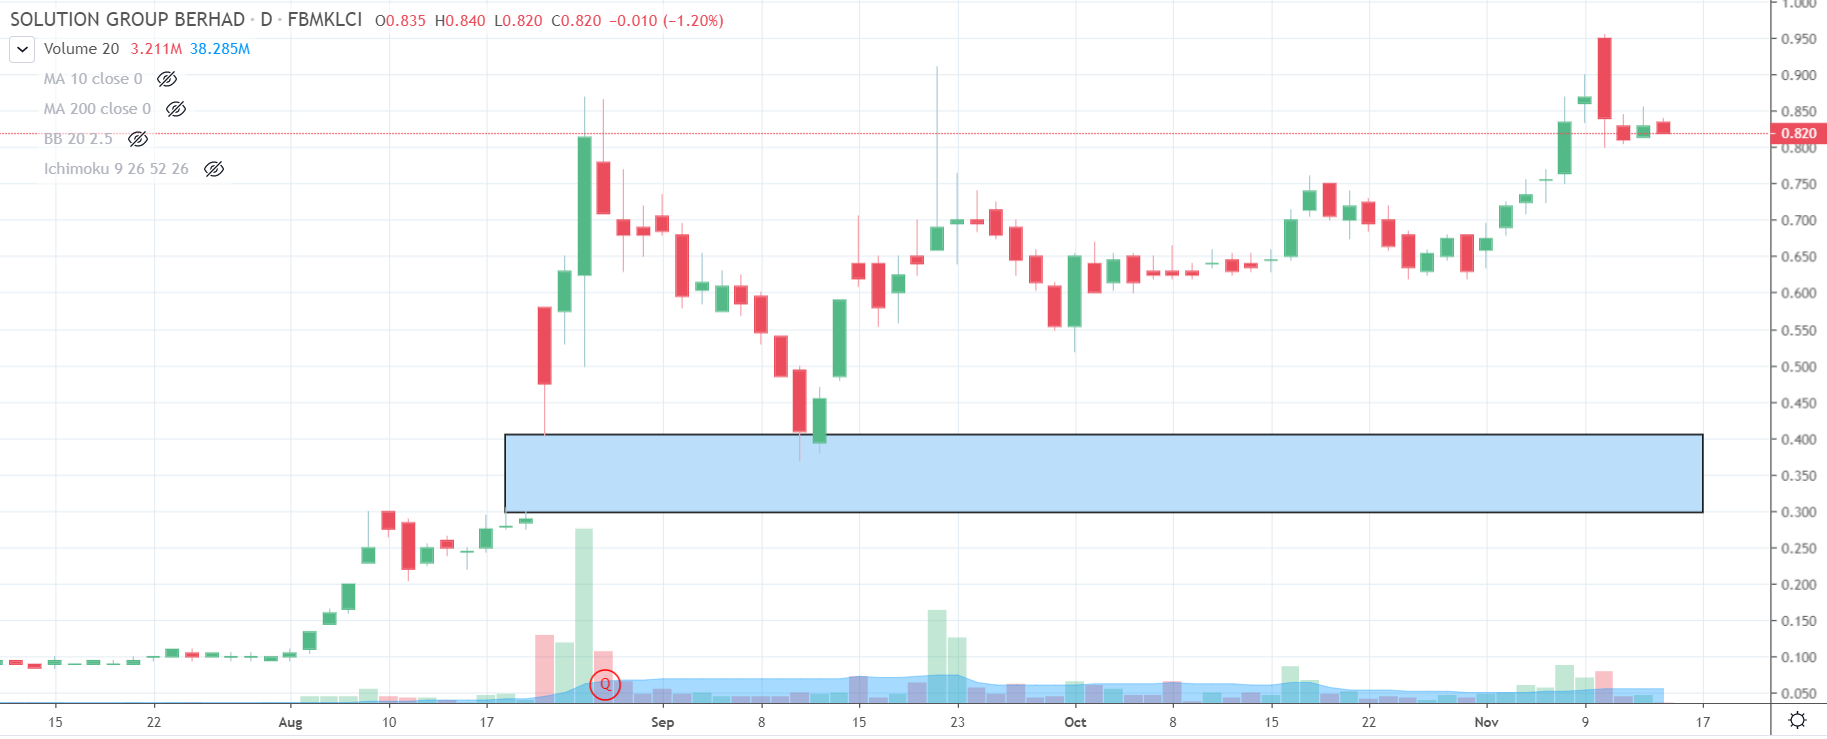
The examples given are SOLUTN and MASTER, these two stocks has some window that we can refer as support and resistance. We can see from SOLUTN that their gap up happened back in August 21st, where the MOU between them and Cansino was announced. Hence, it creates a big window, and act as a strong support in the future. As we can see on September 10th that the price dropped into the window, but rebound very quickly in the next days, and since then never dropped to that price range.
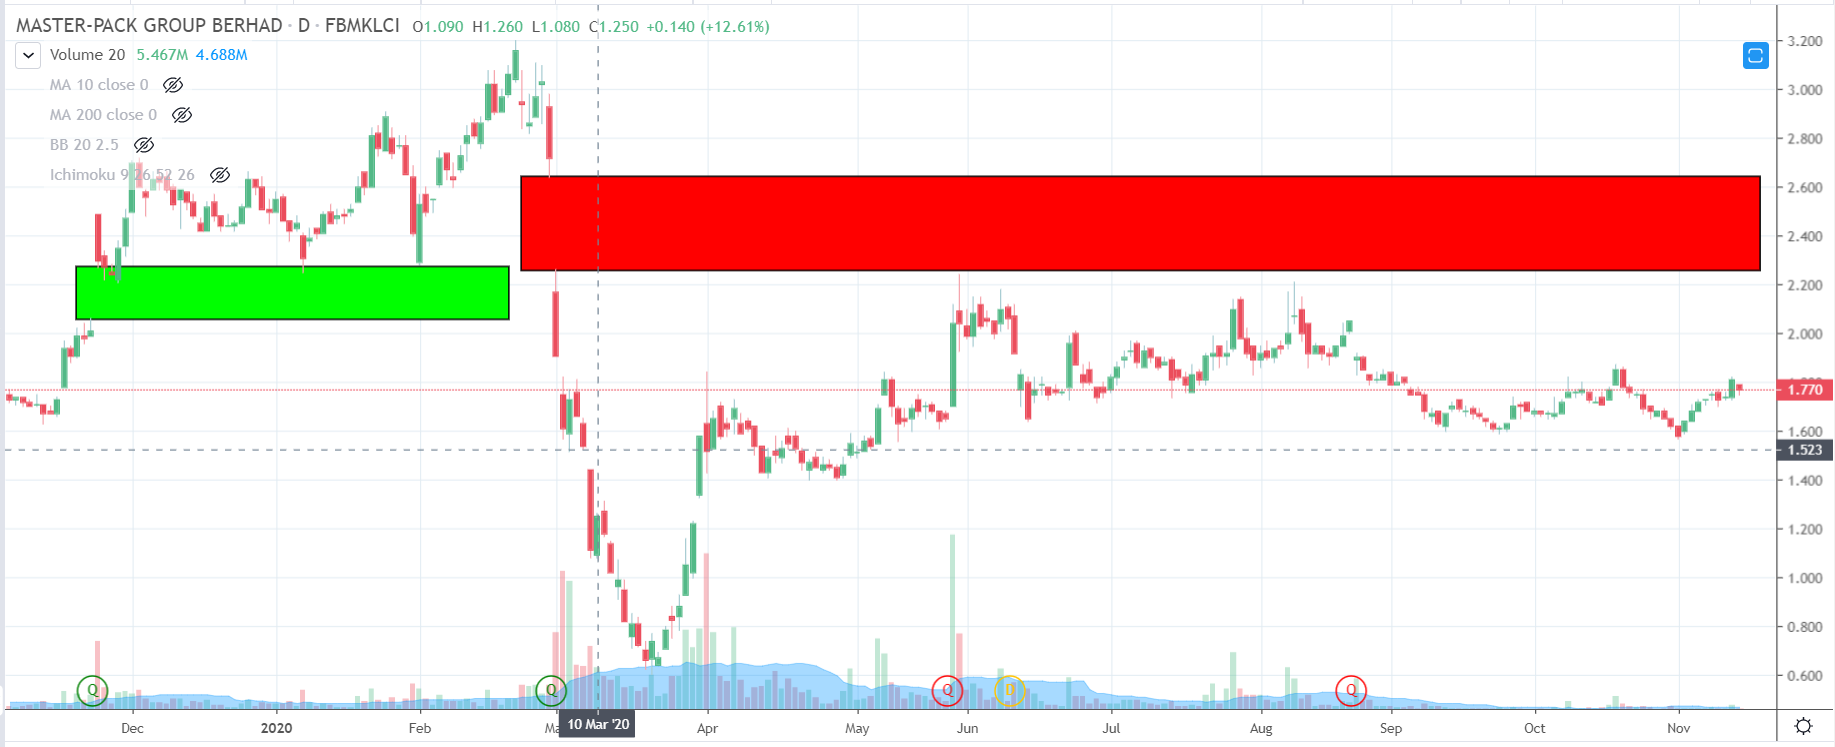
On the other hand, we can see from MASTER’s graph that they have a gap up in November 2019, and a gap down at February 2020. The gap up is due to a good quarter result, where the gap down is due to the bear market occurring on early March, alongside with its poor quarter result. As we can see in the early 2020, that the price will rebound quickly if it touched the window boundary. However, when there is a gap down, it absolutely erased the previous window, and form a new downtrend window, that MASTER has yet to break since.
In short, if a stock has gaps and are able to form a window, it is quite a good indicator to use, in order to determine the resistance and the support of the stock.
当我们在看图时,会有两种跳空,即跳空起和跳空跌,那这些又是什么呢?跳空起的意思是今天的最低点还高过昨天的最高点。举例,今天的最低是RM1而昨天的最高只是RM0.95。
跳空跌是完全相反的,也就是说今天的最高比昨天的最低还低。举例,今天的最高点是RM1,而昨天的最低点是RM1.05。
所以当股价在两天出现跳空的情况,它也很大可能会有“窗口”的出现。而这个窗口会变成你的支持或者阻力范围。我们平时用的都是支持线或者阻力线,可是窗口就犹如更强大的阻力以及支持,毕竟他是一个范围,而不止是一条线。
笔者给的例子是SOLUTN和MASTER,因为这两家公司有我们可以参考的窗口。我们可以看到SOLUTN在八月二十一时有个跳空起而情况,这是因为它与中国的康希诺签署了一个疫苗备忘录,这也造成了SOLUTN有个很大的窗口,亦是给未来股价一个很强大的支持。我们也可以看到它在九月十号的时候股价曾经掉进窗口里,但在过后几天便很快地回弹,并且没再触碰过这个窗口。
另一方面,我们可以看到MASTER的图,它们在2019年的11月,有个跳空起,而也在2020年的2月尾来个跳空跌。跳空起的原因纯粹是因为好的业绩,而跳空跌的原因时熊市的崛起和不理想的业绩所导致。所以我们可以看到在2019年尾以及2020年头,它们的股价就算跌进窗口里也迅速地反弹。但是,当跳空跌发生时,它完全抹灭了之前的窗口,而创立一个新的下跌窗口,因此到今天的股价也未曾突破这个新的窗口。
总结,如果一个股有任何的跳空而形成的窗口,对投资者都是一个不错的指标,因为会比较容易找到一个股的支持点和阻力点。
For more EXCLUSIVE information, visit: https://www.facebook.com/InvestingKnowEverything/
请关注笔者的脸书专页以获得独家资讯。
