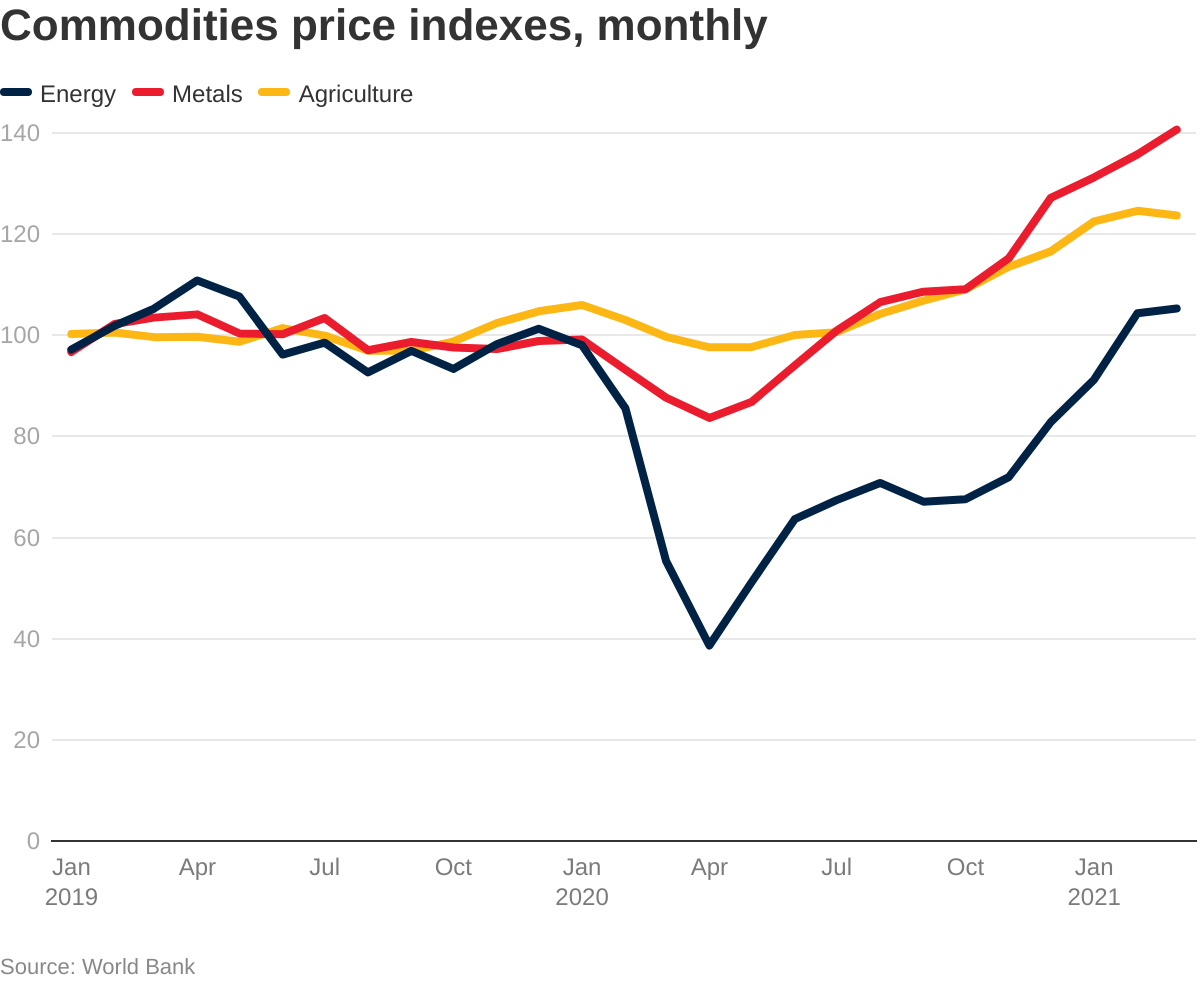
Covid-19 pandemic not only sent the price of medical gloves to the sky, it has also resulted in the surge of almost all commodity price.
As we all know, price is the balance between supply and demand.
In the early stage of the pandemic, demand was expected to drop drastically as there was worldwide lockdown in which movement was restricted and economy came to a halt.
There was fear of unknown at that time and commodities were sold down panically.
However, China as the world's economy powerhouse, managed to contain the pandemic swiftly. Its economy activities rebounded strongly from Q2 of 2020 which resulted in the recovery of demand.
Furthermore, the pandemic has increased the demand of electronic devices, home appliances and furniture etc as many people started to work and study from home.
Low interest rate and various government stimulus packages across the world also encouraged spending on groceries, cars and real properties.
After a shock in early stage, demand slowly crawled back.
As mining, agricultural and manufacturing activities slowed down due to lockdowns, the supply of commodities dropped.
When the demand is higher than pre-Covid level and the supply is significantly lower, the mismatch between supply-demand widens and commodity price shoots up.
Crude Oil
One of the most "famous" commodity is the crude oil. At one stage US WTI crude oil price fell to negative level in Apr20 in which sellers pay buyers to buy their oil.
Brent crude oil price fell to a low of USD20/Bbl in Apr20 but has since recovered steadily to pre-Covid level of USD60-70/Bbl, as shown in the 10-year price chart below.
Brent Oil (USD/Bbl) 10-years chart
Unlike many other commodities which have reached historical high or multiple years high, Brent oil is still far from its 10-year high of USD120/Bbl in 2011 and historical high of USD140/Bbl achieved in 2008.
Brent oil is not expected to go above USD100/Bbl anyway. To stay between USD60-70 in year 2021 is good enough while reaching 2018's high of USD80 will be a bonus.
A drop below USD60 is very possible though, when OPEC+ decides to ease their production cut.
However, when travel ban is lifted across the globe, crude oil demand should pick up fast.
Direct beneficiaries of high crude oil price will certainly be upstream Oil & Gas companies such as Hibiscus, Reach & DNEX.
Mid stream players will benefit indirectly from more contracts awarded due to increase in O&G upstream activities.
Recent oil price recovery is the fastest in the history as shown in line chart below.
Crude Palm Oil
The price surge of crude palm oil can be described in one word: unbelievable.
Decline in CPO production and expected higher demand from two of the world's largest CPO importer China & India play a part in the price rally.
Palm Oil (MYR/T) 10-years chart
From below RM2,000/T exactly one year ago, palm oil price has surged to historical high of RM4,500/T now. Its previous historical high was at ~RM4,000/T in 2008.
There are many upstream oil palm plantation companies listed in Bursa Malaysia. Most of them have already enjoyed a good year in 2020. If the CPO price stays above RM4,000, then surely year 2021 will be even a better year.
The question is, how long can the CPO price stay above RM4,000/T?
Earlier in the year industry experts have forecast CPO price to range between RM3,320 & RM4,113 per tonne in 2021, and will soften in the second half of the year.
Despite the spike in CPO price, plantation stocks seem to be not that popular among investors, perhaps the attention has been hijacked by gloves stocks and then tech stocks.
Increasing CPO price might not guarantee increasing profit for a plantation company. It depends on the volume of FFB (Fresh Fruit Bunch) & CPO produced and sold.
The lack of manpower, bad weather and unfavourable age profile of oil palm trees will negatively affect the production of FFB.
If the average CPO price increases by 20% but the volume sold decreases by 20%, then there will be no significant increase in profit.
Nevertheless, plantation companies will have good days ahead, with lots of cash too.
Soybeans
As a competitor to palm oil, the price of soybeans also staged a sudden surge since mid 2020 to come close to its historical high.
Soybeans (USD/Bu) 10-years chart
Corn
Soybeans and corns are important crops to the US. The price chart of both commodities are quite similar in which corn price also threaten to break its historical high.
Corn price has steeper rise in the year of 2021 as its price has gained more than 50% YTD compared to soybean's 25%.
Corn (USD/Bu) 10-years chart
Apart from being used as food ingredient, soybeans and corns are widely used as animal feeds.
One of the important reasons of their price surge is due to sudden surge in demand from China who is expected to recover fully from African Swine Fever in 2021. China has lost almost 50% of its swine population to African Swine Fever since 2018.
High soybeans and corn price is no good news to poultry farming industry in Malaysia as both are used as chicken feeds and make up around 70% of the cost.
Thus, LHI, Lay Hong, Teo Seng, LTKM, PWF, CAB and QL will surely face increasing cost pressure.
Rubber
Once an important commodity for Malaysia, rubber plantation is not that popular nowadays. Thailand, Indonesia and Vietnam are the 3 largest natural rubber producing countries now.
Rubber (JPY/Kg) 10-years chart
As we can see from the price chart, rubber price has increased more than 100% from its low in mid 2020. Current price of JPY250/Kg is higher than year 2018 & 2019.
Again, strong demand from China is cited as the main reason for the price increase.
There are a few listed companies with rubber plantation but I don't think the profit contribution will be of any significance.
The cost of manufacturing rubber gloves will be higher though.
Naphtha
Naphtha is a liquid petroleum derived from crude oil so its price tends to follow crude oil price. One of its many uses is as raw material of plastics.
Naphtha (USD/T) 10-years chart
Without exception, the price of Naphtha recovered from its low of USD150/T in mid 2020 to USD600/T now.
Current level is slightly higher than 2019's average of USD500/T but still lower than 2018's peak of USD700/T.
LCTitan uses Naphtha as its main raw material to produce resins used in plastic products manufacturing (HDPE, LDPE, PP) and nitrile gloves (Butadiene).
While LCTitan might not enjoy the low Naphtha price environment for too long, plastic products manufacturers will not be able to enjoy low resins price for long too.
Companies involved in plastic packaging include Scientex, Thong Guan, BPPlas, SCGM, SLP, Tomypak etc while companies in plastic injection moulding include ATAIMS, VS, SKPRes, EG, Geshen, PIE etc.
Rising resin price will reduce their profit margin unless they can pass the cost to their customers.
LLDPE price chart (CNY)
Lumber
Quietly, lumber or timber price surged almost 6x from USD260 in Apr20 to USD1,600 in May21. Will logging companies in Malaysia receive a windfall?
Lumber (USD/1000 board feet) 10-years chart
Listed logging companies that I know include Ta Ann, Timwell, WTK, Subur, JTiasa, BTM, Minho and GPharos.
It seems like only Timwell is pure upstream player while the others have other businesses such as downstream wood manufacturing, oil palm plantation, property development etc.
From a quick check on their most recent financial results, I think most of them registered loss in timber division even though lumber price was already very high in the second half of 2020.
The prospect given on timber industry from most companies was quite negative.
Now lumber price has jumped even higher in Q2 of calendar year 2021. Can those companies do well this time?
Ta Ann, WTK, Subur & JTiasa have both oil palm plantation and timber business. They must be very happy to see both commodity price breaking new high.
Particleboard
From the price chart below, it seems like the price of particleboard & fiberboard also rise significantly in the past one year.
Hardboard, Particleboard & Fiberboard Products 10-years chart
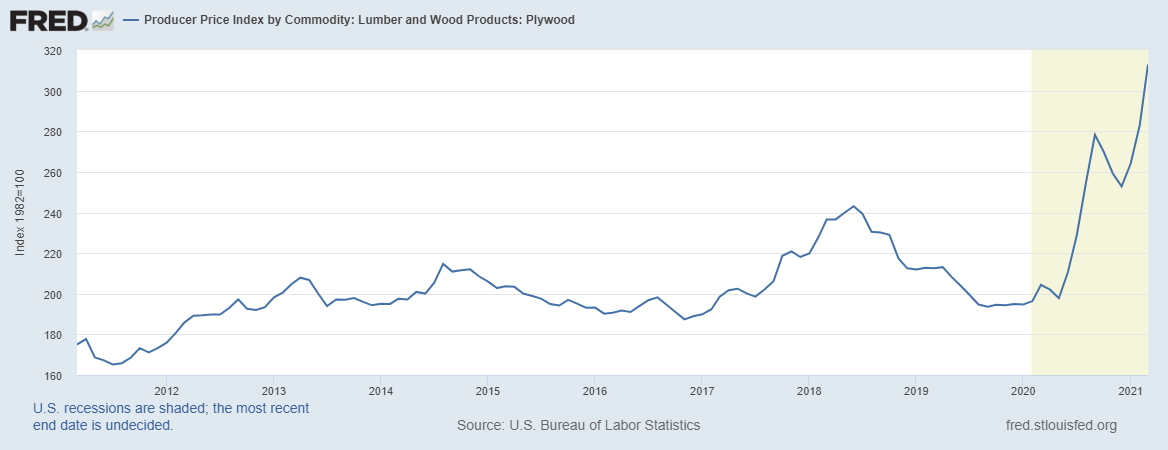
Price chart of plywood also shows similar trend as below.
http://bursadummy.blogspot.com/2021/05/commodity-super-bull-run-part-12.html