MACD = Moving Average Convergence Divergence, a momentum that follows the latest trend, showing the relationship between two moving averages
MACD = 12-period EMA – 26-period EMA
Since it is a subtraction, there will be a positive value and a negative value. When the blue line is above red line, the value will be positive, Conversely, the value will be negative. The farther the distance between two lines are, the obvious the stock momentum is.
Other than two lines, there is also one histogram that indicates the subtracted value mentioned earlier, hence it will be positive value when blue is above red.
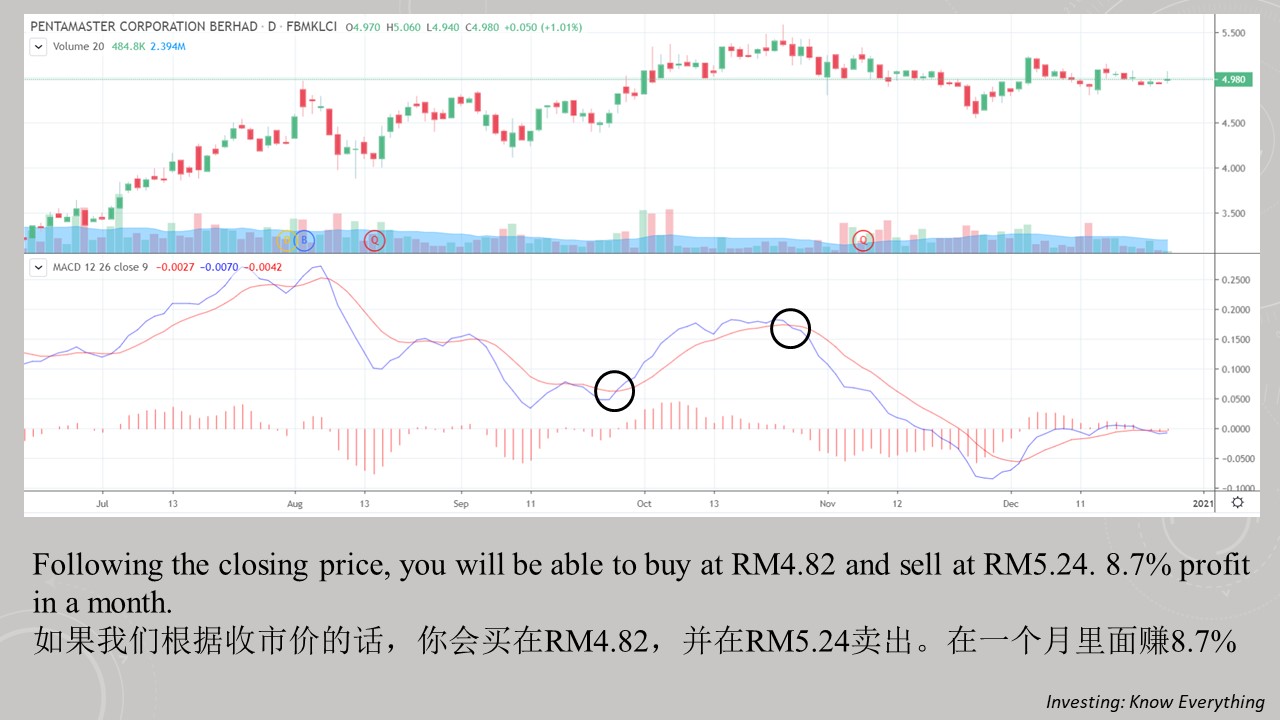
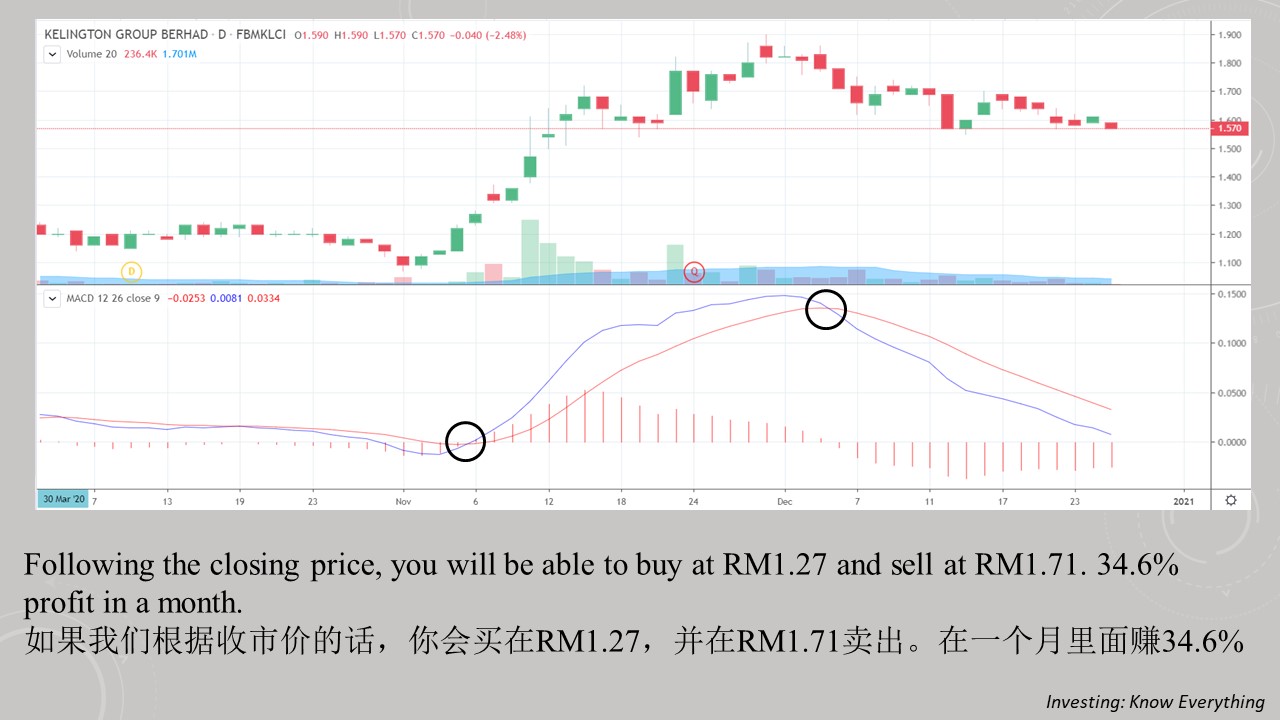
Traders will use this as an indicator, where they buy when the value turns positive (also known as golden cross), and sell when the value turns negative (also known as death cross). Let see some examples whether this works.
Let also not just see some good examples, let see some examples that don’t work.
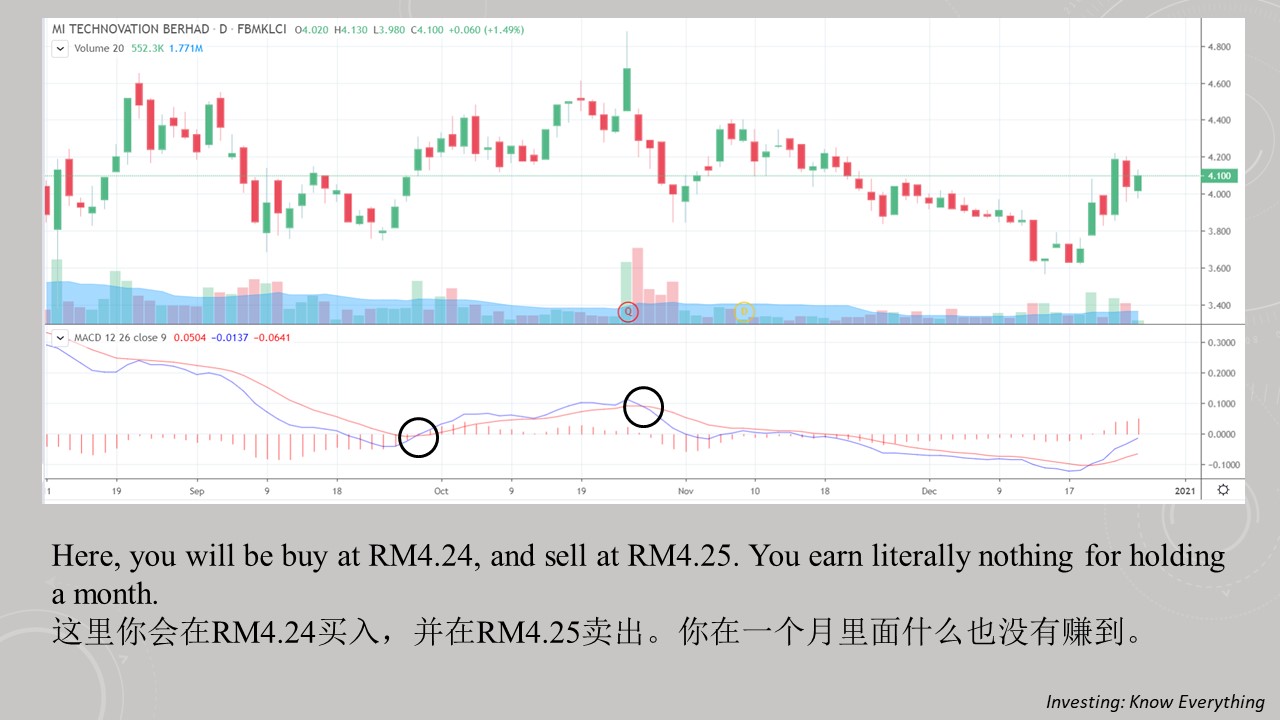
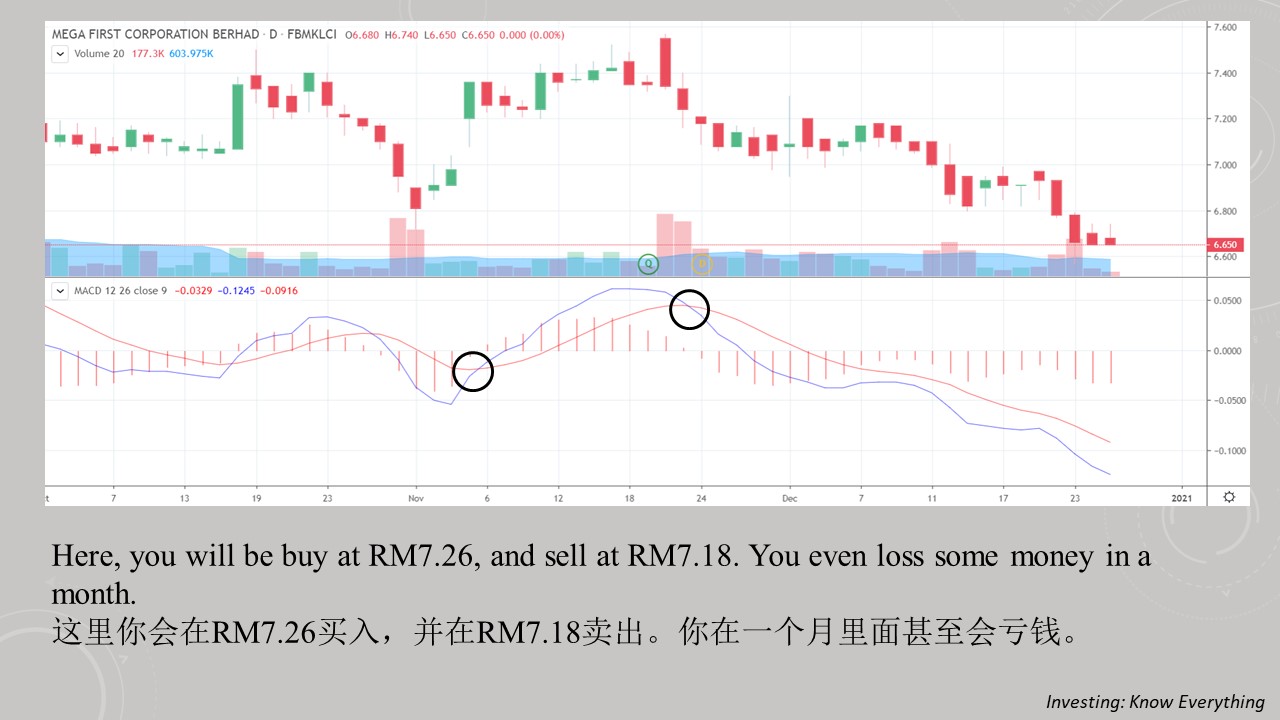
So, why will we lose money even using MACD indicator? This is because it is a laggard indicator, that was calculated based on their historical performance, hence a good performance before will not equal to a good performance now.
This is also one of the disadvantage of MACD: False positive. This means that the positive value does not necessary indicate the stock will move uptrend, but can be sideways too.
Other than just golden cross and death cross, we can also try the combination of price and MACD to prevent false positive as much as possible, and it is called bullish and bearish divergence.
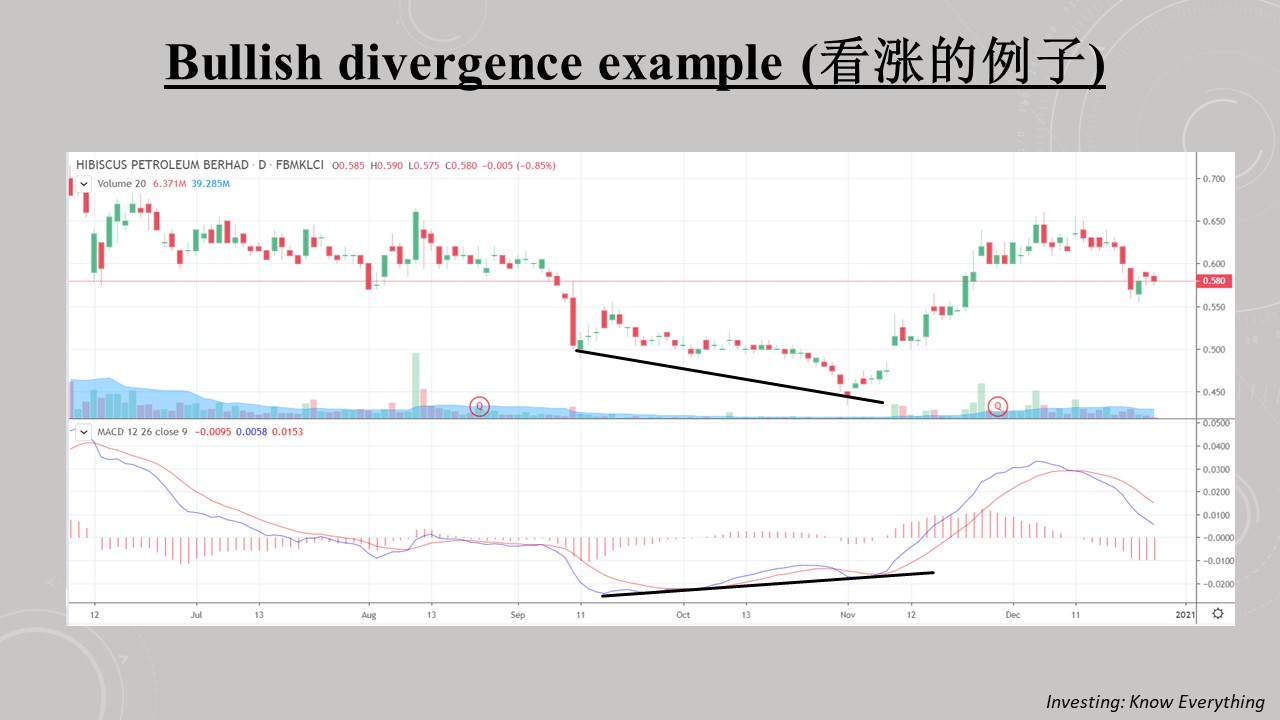
The second MACD was higher than the first one, but price wise, the second one is lower than the first one. This is called bullish divergence, that presume the stock will move upwards in a longer term, and it did.
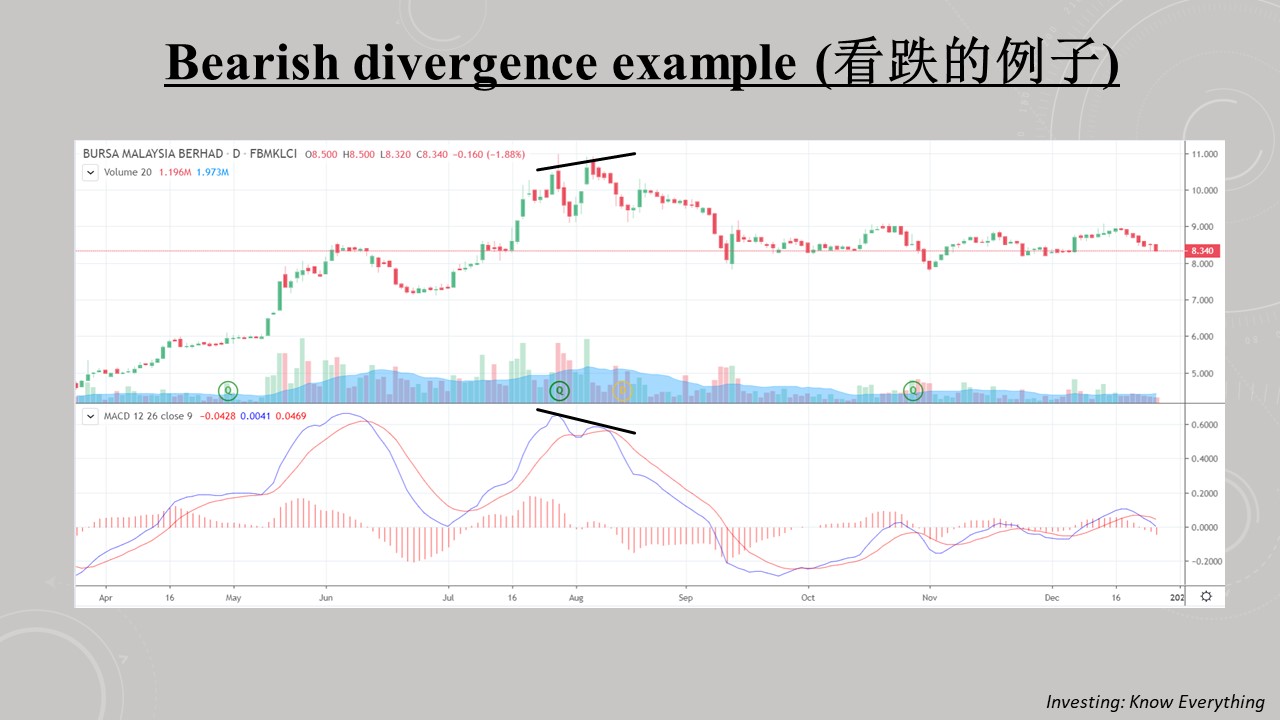
This time, the second MACD was lower than the first one, but price wise, the second one was higher than the first. This is called as bearish divergence, where they see the share price to fall in longer term, and well that is true as well.
HOWEVER, this does not mean that every time this happen, the share price must move up or down. This is just example that did, there maybe also some that defy this logic.
In short, MACD itself does not necessary be effective, but it also need the help from other indicators as well. Besides, TA is mainly used on trading but not investing, hence the risk is still there as indicators may not always be right. Fundamental of the company still remain the priority, but also be assisted by indicators like this to buy or sell.
MACD = 移动平均总汇的分或离,它是一个跟着最新趋势的势头,并且显示两个移动平均线之前的关系。
蓝线是12天指数移动平均线,红线是26天指数移动平均线,把这两个相减就会得到MACD。
既然用的是减法,那就一定有正数和负数。当蓝线在红线上面时,数值便会是正数,反之便会是负数。当两条线的距离越远时,代表着股的势头越明显。
除了两条线以外,它还有个直方图代表着刚刚说到的相减数值,所以当蓝线在红线上面时数值会是正数。
交易者会用这个来当他们的指标,他们会在正数的时候买入(黄金交叉),而在负数的时候将他们卖出(死亡交叉)。让我们来看看一些例子吧。(请看以上PENTA和KGB的例子)
我们也不能只是看一些好的例子,我们也要看看失效的例子。(请看以上MI和MFCB的例子)
那为什么我们用了MACD指标后还会亏钱?这是因为它是一个根据历史股价表现而显示出的落后指标,但要知道之前的好表现不一定代表现在的好表现。
这也是MACD指标的弱点之一: 假正数。意思是尽管数值是正数的,但并不代表它的趋势向上,也有可能是横摆趋势。
除了刚刚提到的黄金交叉和死亡交叉,我们也可以试看结合价钱和MACD以尽量避免假正数的情况,那就是“牛分歧”和“熊分歧”,简单来说就是看涨还是看跌。
(参考以上看涨的例子)第二个MACD的线明显高过第一个,但价钱却相反,第二个的价钱还低过第一个。这就是看涨,预测股价会在比较长期以后上涨,而事实的确如此。
(参考以上看跌的例子)这次,第二个的MACD比第一个的低,但是价钱却相反,第二次的价钱比第一次的高。这也是看跌的指标,在比较长期的情况股价会下滑,和事实再次证明的确如此。
但是!这不代表每次指标出现的时候,股价一定上涨或者下跌。这些只是成功的例子,也有可能有股是用不着这种指标的。
总结,MACD本身并不一定很奏效,他也需要其他指标的配合。此外,技术面主要是用于交易而非投资,也因为指标不一定正确所以也有一定的风险。公司的基本面依然是最重要的,但他也同时可以指标的帮助下买进/卖出。
For more EXCLUSIVE content, visit: https://www.facebook.com/InvestingKnowEverything/
请关注笔者的脸书专页以获得独家资讯。
https://klse.i3investor.com/blogs/InvestingKnowEverything/2020-12-29-story-h1538427320.jsp
