Weekly Time Frame
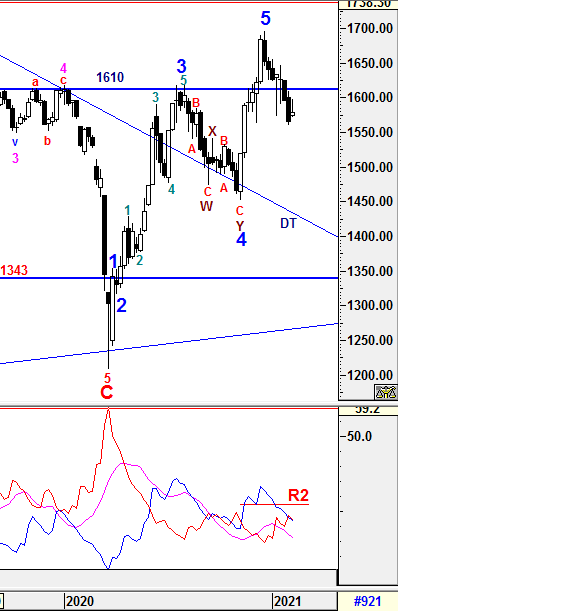
To recap, breaching of immediate support 1590-1593 had initiated a strong momentum to the downside. Due to the current momentum, downward pressure would continue in coming weeks. For the past few days, it made a soft rebound and consolidated by forming an Harami Candlestick Formation which indicated trend reversal might be taken place. However, the validity of these formation is required if it able to close above 1600 on next coming Thursday. Therefore, i will still remain caution until clearer signal emerged.
To reiterate, the Higher Degree of Correction waves are still being constructed after Wave 5 has been realized at 1695.87 instead of 1695.96. Subsequent minor waves would be elaborated further in daily time frame.
1) -DMI (red line) curved down with narrow margin indicates bearish momentum is decreasing with slower pace.
2) +DMI (blue line) still heading down with narrow margin indicates bull strenght is still decreasing with narrow pace and it still hovering below R2 indicates caution mode is still required.
3) ADX (pink line) still heading down with consistent margin implying that the volatility of the current trend is still low.
Therefore, the summations of the 3 signals above
is still implying uncertainty is still emerging with narrow margin and
caution is still required for any unexpected knee jerk reaction. From current situaton, +DMI is still below -DMI indicates Bear strenght is in favor but lower volatility, an continuous increased in ADX reading to would justify a prominent uptrend to be developed.
Prevailing trend could be emerged if Weekly levels listed below was broken:
Resistance - 1642, 1650, 1700, 1720
Immediate Resistance - 1590-1593, 1610, 1621-1624, 1635
Immediate Support - 1575, 1564, 1556,1530
Support - 1490, 1432 (DT line)
Daily Time Frame
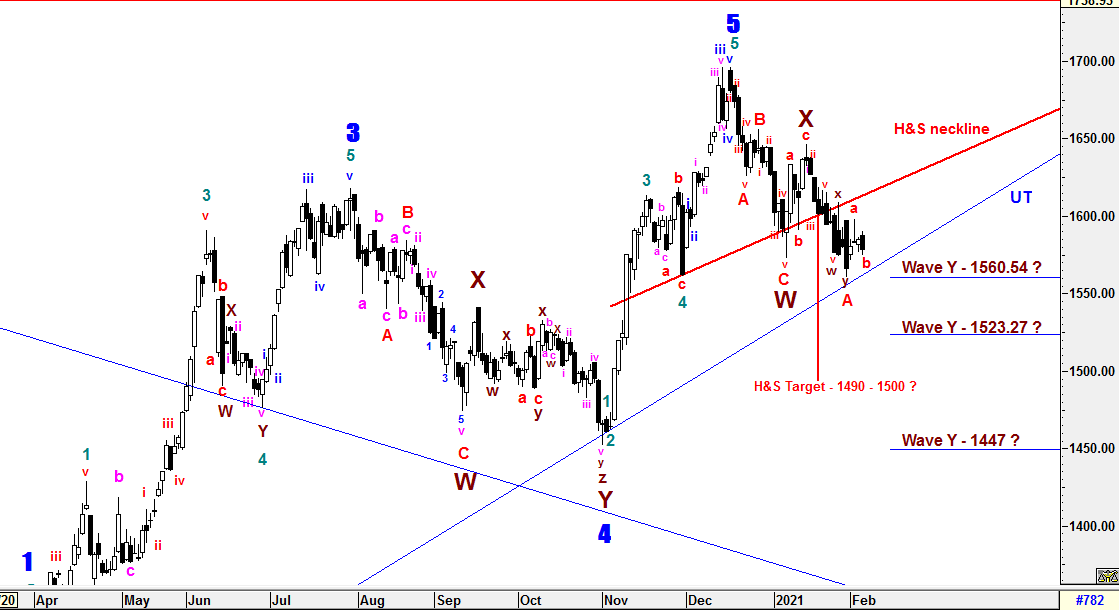
To recap from prior session 43, Wave Y was still being constructed with complex sub minuette waves 1-2-3-4-5 (w)-x and sub minuette waves y was on its way. Besides that, the minimum criteria of FIBO 61.8%(1571) had been met to complete the WXY complex correction at 1560.54. Due to the current degree of momentum, i would not rule out that Wave Y would end at much lower level if UT line is breached. If the UT line breaching incurred, we would see Wave Y might be ended at 3 possible targets at 1523 (FIBO 100%), 1447 (161.8%) or Head and Shoulder Formation breakout target (1490-1500).
Even UT line is still hold, it is still the critical level to watch for validating the Head and Shoulder Formation breakout to the downside. Otherwise, the formation will be invalid if it able to move up and close above H&S neckline convincingly.
Currently, sub minuette wave y had ended at 1560.54 and complex sub minuette waves 1-2-3-4-5 (w)-x-y had been completed In conjunction with wave A. Besides that, sub minuette wave a (5 waves) and b (3 waves) had been formed and sub minuette wave c could be on its way towards completion of wave B at higher level. Any further rebound might be resisted at H&S neckline where wave B could be ended at around 1598-1613.
The entire wave structures will still be monitored closely if the high of Wave X at 1646.24 is breached which indicates Higher Degree of implusive Wave 1 could have emerged. If it is true, Wave Y would be revised and ended at 1560.54 instead of wave A. Thereafter, a new set of Higher Degree of 5 Waves Bull Run may take place and Primary Wave 3 would be emerged which i should label from the start. Thanks for an input from an 3i member on the Highest Degree/Primary Waves labelled counts.
All waves' count and projected target are
generated based on past/current price level and it may be subjected to
vary if degree of momentum movement change.
Prevailing trend could be emerged if Daily levels listed below was broken:
Resistance - 1639-1631, 1650, 1662, 1679, 1685, 1700, 1720
Immediate resistance - 1580, 1590, , 1610, 1615, 1620
Immediate Support - 1572, 1560, 1554-1551, 1538-1545
Support - 1530, 1490
HARTA & TOPGLOVE Waves
==================
To Recap, 3rd sub minuette of 3rd sub minuette waves extension might
being constructed as labelled and upside momentum is still valid unless
certain criteria of wave counts are breached as below.
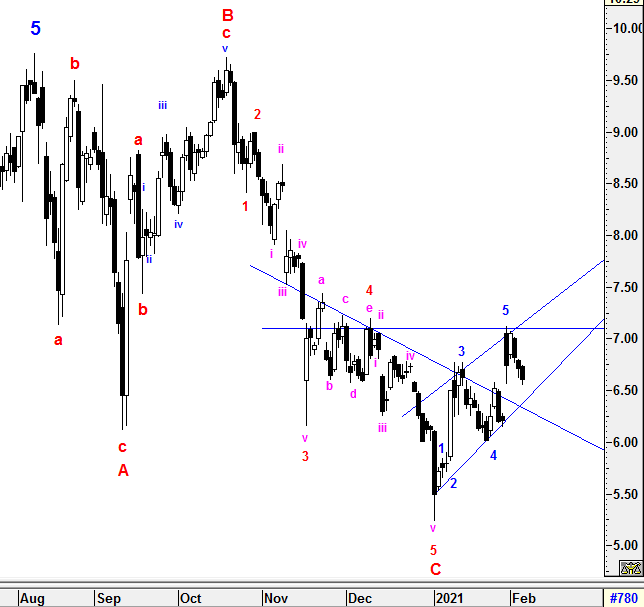
Due to momentum changes, the high of i th sub minuette wave had been overlapped and the entire wave structure has been revised as labelled.
For HARTA, 5th sub minuete wave is still being constructed with possible extension waves emerge. Currently, it has been consolidated and forming an bullish pennant for an possible breakout but being resisted at the gap in between RM13.40 and 13.66. If it able to pass through these gap, there would be 5th wave extension emerged.
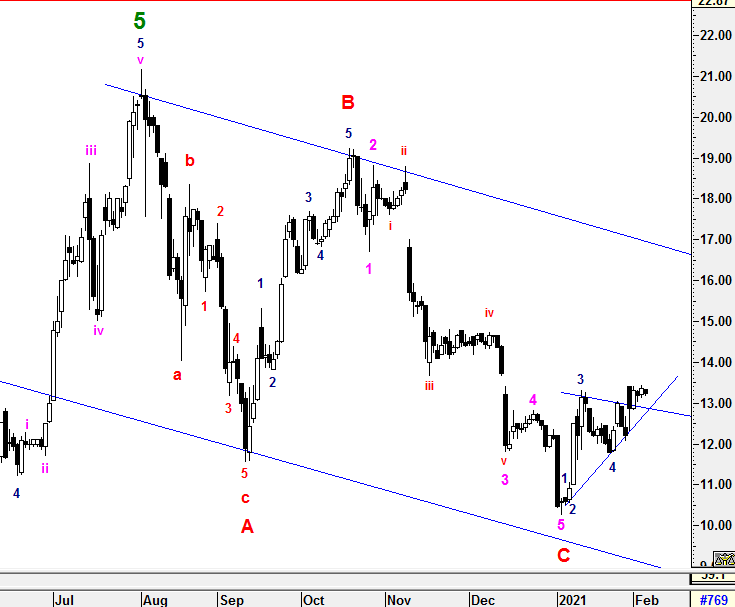
For TOPGLOVE, 5 sub minuette waves could have completed and correction minuette waves are still underway which would be end soon at around 6.51- 6.52. I believe ascending
channel (Diagonal Formation) could initiate an impulsive wave to the
upside. Otherwise, the correction phase would be extended if lower
channel line breach. Major resistance at RM7.10.
The entire wave structures will still be monitored closely and revised if Wave C is breached which may indicate complex minuette waves or new sub minuette extension waves within Wave C could emerged where would lead to lower level.
All
waves' count and projected target are generated based on past/current
price level and it may be subjected to vary if degree of momentum
movement change.
HARTA
=====
TOPGLOVE
=======
==================================================================================
Patient is required for the SUPER CYCLE Bull Run.
==================================================================================
Let's Mr Market pave the waves.
Trade safely
Wave Believer
https://klse.i3investor.com/blogs/E_Wave/2021-02-07-story-h1540987364-KLCI_waves_44_KLCI_To_Challenge_Head_Shoulder_Formation_and_BEST_Glove_.jsp
