FBM KLCI - likely to consolidate
 Stocks
on Bursa Malaysia closed mixed last Friday with the benchmark FBM KLCI
ended the week easier, dragged down by selling in finance and banking
stocks led by Maybank. The local bourse closed lower for three
consecutive days on continued profit-taking, and this curbed interest
despite the positive performance in the US and regional markets. The FBM
KLCI fell 5.08 points or 0.27% to 1,844.31 points, after fluctuating
between 1,840.77 points and 1,849.78 points throughout the day. On a
weekly basis, the FBM KLCI gained 9.79 points from 1,834.52 on previous
Friday. Gainers led losers by 422 to 403, while 330 counters were
unchanged. Total volume improved to 1.85 billion units worth RM1.8
billion from Thursday’s 1.8 billion units worth RM1.79 billion. Weekly
turnover decreased to 9.42 billion units worth RM9.26 billion from 10.94
billion units worth RM9.06 billion the previous week.
Stocks
on Bursa Malaysia closed mixed last Friday with the benchmark FBM KLCI
ended the week easier, dragged down by selling in finance and banking
stocks led by Maybank. The local bourse closed lower for three
consecutive days on continued profit-taking, and this curbed interest
despite the positive performance in the US and regional markets. The FBM
KLCI fell 5.08 points or 0.27% to 1,844.31 points, after fluctuating
between 1,840.77 points and 1,849.78 points throughout the day. On a
weekly basis, the FBM KLCI gained 9.79 points from 1,834.52 on previous
Friday. Gainers led losers by 422 to 403, while 330 counters were
unchanged. Total volume improved to 1.85 billion units worth RM1.8
billion from Thursday’s 1.8 billion units worth RM1.79 billion. Weekly
turnover decreased to 9.42 billion units worth RM9.26 billion from 10.94
billion units worth RM9.06 billion the previous week. Continuing
the uptrend from previous Friday, the FBM KLCI opened last Monday 6.33
points higher at 1,838.30 and pulled back to hit the intra-day low of
1,837.51, which later turned out to be the intra-week low, and the FBM
KLCI rebounded to close 8.42 points higher 1,842.94. Tuesday saw
persistent buying in selected index-linked heavyweights by funds which
pushed the FBM KLCI to close at a seven-month high of 1,856.51, up 13.57
points, which is also the intra-week high. Profit taking emerged on
Wednesday which dragged the FBM KLCI 6.20 points lower to 1,850.31, and
persistent profit taking on blue-chips on Thursday and Friday saw the
FBM KLCI losing 0.92 point to 1,849.39 and another 5.08 points to end
the week at 1,844.31 points.
Continuing
the uptrend from previous Friday, the FBM KLCI opened last Monday 6.33
points higher at 1,838.30 and pulled back to hit the intra-day low of
1,837.51, which later turned out to be the intra-week low, and the FBM
KLCI rebounded to close 8.42 points higher 1,842.94. Tuesday saw
persistent buying in selected index-linked heavyweights by funds which
pushed the FBM KLCI to close at a seven-month high of 1,856.51, up 13.57
points, which is also the intra-week high. Profit taking emerged on
Wednesday which dragged the FBM KLCI 6.20 points lower to 1,850.31, and
persistent profit taking on blue-chips on Thursday and Friday saw the
FBM KLCI losing 0.92 point to 1,849.39 and another 5.08 points to end
the week at 1,844.31 points.On the weekly chart, the FBM KLCI formed a white shooting-star candlestick, a top reversal candlestick pattern which indicates heavy profit-taking activity after the key index ran up for four consecutive weeks, and hence, the FBM KLCI is likely to further consolidate in the coming week with immediate weekly downside support zone at 1,837 to 1,831, while the overhead resistance zone is at 1,856 to 1,880. On the daily chart, the FBM KLCI formed a bearish black spinning-top on Friday which indicates uncertainty of market direction with a downward bias amid consolidation. Thus, the FBM KLCI is likely to further consolidate today with immediate downside support zone at 1,840 to 1,837, while the overhead resistance zone is at 1,850 to 1,856.
Weekly MACD continued to rise, and its histogram also extended higher, indicating an increased in momentum to the upside. Daily MACD, however, turned downward and its histogram also further contracted downward, indicating further loss momentum amid consolidation. Weekly RSI (14) was higher at 57.5 from 55.9, indicating further improvement in the weekly relative strength to the bullish side of the mildly bullish zone. Daily RSI (14) was however lower at 62.7 from 66.3, indicating further correction or consolidation was taking place. Weekly Stochastic was higher at 92 from 88.4, indicating further improvement in the index strength and continuation of the weekly up cycle. However, daily stochastic slipped lower to 85.8 from 92.7, indicating profit taking correction is underway. In short, readings from the weekly indicators showed that the FBM KLCI is in a mildly bullish state, while readings from the daily indicators showed that the FBM KLCI in undergoing a correction after the recent rise. Hence, the FBM KLCI is likely to rise further after the profit-taking correction is over.
The short, medium and long term trend of the FBM KLCI still remained up. However, with the pullback on the last three sessions, the immediate short term trend has turned down as the key index has closed below the 5-day simple moving average (SMA), but is still staying above the 10-day SMA. Hence, for the coming week, the FBM KLCI is likely to further consolidate to digest the overbought situation before continuing its uptrend. On the broader market, rotational play on small caps and ACE market will continue despite a slowdown in momentum as shown by a decreased in the trading volume.
Last Friday, the Dow rose 98.92 points or 0.55% to close at 18,057.65. This week, the FBMKLCI is likely to trade within a range of 1,798 to 1,858, and today, the FBMKLCI is likely to trade within a range of 1,823 to 1,843.
This week's expected range: 1816 – 1875
Today’s expected range: 1831 – 1858
Resistance: 1849, 1853, 1858
Support: 1831, 1835, 1840
Stocks to watch: AEON, APFT, BJCORP,
BREM, CAELY, CBIP, CONNECT, EG, EKSONS, ELKDESA, HHGROUP, HOVID, JAKS,
KSSC, KANGER, KRONO, LUXCHEM, MMODE, MPAY, RUBEREX, SEALINK, SYSCORP,
SYCAL, TAS, TEKSENG, TNLOGIS, TROP, XINQUAN
Stock pick highlight: EG (8907)
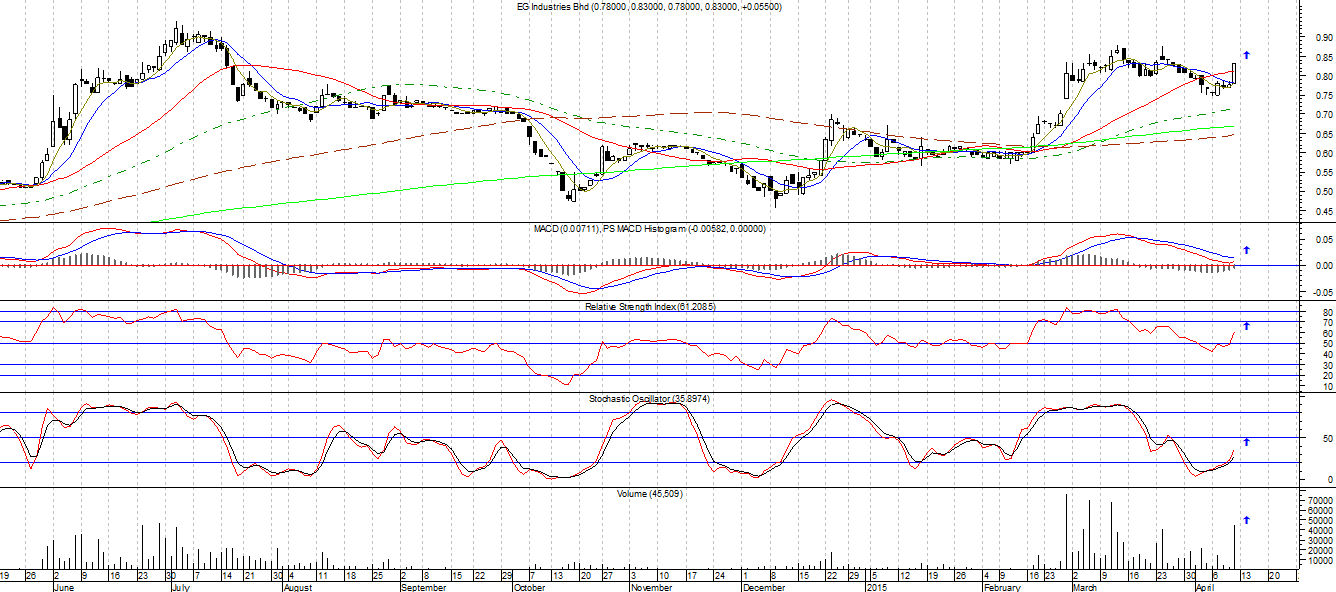
Last Price: RM0.83 +0.055
Support Level: RM0.78, RM0.745
Resistance Level: RM0.83, RM0.85, RM0.865, RM0.88, RM0.90, RM0.94, RM0.98, RM1.06, RM1.11
Entry Level: RM0.55 – RM0.56
Technical Analysis
EG (8907) rebounded from its intra-day low of 0.78 to close higher at the intra-day high of 0.83. Technically, the chart of EG formed a bullish Marubozu candlestick with increasing volume, indicating strong buying interest came into the stock on Friday. It breaks out from the consolidation range forming a small Rectangle pattern breakout. MACD hooked upward but is still below the signal-line, and its histogram also further contracted upward, indicating an increased in momentum to the upside and a buy signal. RSI (14) rose to 61.2 from 48.6, indicating the stock is turning bullish from a mildly bearish state. Stochastic rose to 35.9 from 23 and is above the slow stochastic line, indicating the stock is turning stronger after recent consolidation. The medium and long term trend of EG is up, and the short term trend is turning up with the 5-day SMA just below the 10-day SMA and is also below the 30-day SMA but the candlestick already closed above all three moving averages, and a confirmed breakout above RM0.83 will see an upside target of RM0.85, follow by RM0.865, RM0.88, RM0.90, RM0.94, RM0.98, RM1.06 and RM1.11.
Since the short term trend is bullish, day traders with shorter time frame perspective may ride on the short term bullishness and buy on breakout level (RM0.83). Those with lower risk appetite should wait at the side-line and buy on the dip.
Price Objective
Short Term – target price at (RM0.85, RM0.865, RM0.88, RM0.90), stop loss (RM0.775)
Mid Term – target price at (RM0.94, RM0.98, RM1.06, RM1.11), stop loss (RM0.74)
Disclaimer: The content on this site is
provided as general information only and should not be taken as
investment advice. All site content, shall not be construed as a
recommendation to buy or sell any security or financial instrument. The
ideas expressed are solely the opinions of the author. The Stocks to
watch is not a recommendation to buy or sell the particular stock, as it
is only meant for graduates of the "Share Trading the Pro Way" course
as case study. Any action that you take as a result of information,
analysis, or commentary on this site is ultimately your responsibility.
Consult your investment adviser before making any investment decisions.
http://millionairetrendtrader.blogspot.com
