Friday, January 15, 2016
Instacom has been hogging the limelights since November last year. My feel is that if it was just a pump and dump, they would have dumped already. We have to be cognisant of the fact that it is no longer a telco tower kind of company, in fact profits from that industry alone will amount to less than 5% of this year's earnings.
So, where is Instacom going? Or should I refer to as Vivocom?
a) Anyone who do not believe in their "china-play" story can sell, and would have already... looking at the shaky global developments in recent weeks (oil going below US$30; yuan devaluing; China sending troops to fight ISIS; etc...). No doubt about that, if you don't wish to part of the story, you can opt out anytime and many have done so. Which is a revealing tell for the price action / volume to see the shares still above 28 sen after all that.
b) Hence, despite all that has happened, the share price has settled very nicely above 27.5-28.5 sen. which is comfy above the small 5% new share issue levels. Even if those people wanted to get out, there is sufficient liquidity for them to exit.
c) Look at Edra, look at 1MDB, who has been buying??? Look at Penang under water tunnel, who had the better financing. Gemas??? etc... what else. Its not that Malaysia wants to get China's investments, but no one else seems to be looking or wanting to invest!!!. The Middle East has problems of their own, Japan as well... no one seems keen to provide long term FDI... except China. I do not need to go into why Vivocom has a good relationship with CCRC and possibly other China mega counters. Please read the CIMB report.
d) Either the entire thing is a scam, or its true... how to scam with CRCC?????, the projects are there already, it is one of the top 100 listed companies in China, they can see the news, they can read the blurbs. Yes, it may take some time for markets to give the stock a proper valuation - currently we are looking at less than 5x prospective earnings. I do believe if and when the quarterly figures come in in line or above valuations/expectations, we will see huge spurts then.
e) To be fair, you cannot ascribe a 10x earnings on a completely new RTO business, no matter how attractive it may be. It has to be gradual, as more confirmation on quarterly earnings and new projects being won.
To that end, I have just come across a faed technical chartist and got his email on his view on Instacom. Our ways of interpreting data may be different, but I think we come to the same conclusion.
......................................
by G.M. Teoh

INSTACOM GROUP BHD – Quantitative Algorithm Analysis
Instacom Group Bhd has transformed into the biggest Ace company in Malaysia and remained the market volume leader for the past several weeks, a phenomena seldom seen in Malaysian stocks.
Traders and investors expressed their confidence and views on its exciting future growth prospects and bright potentials by buying heavily into this stock.
Let us look at the reality and try to forecast the price outlook of this stock utilizing Quantitative Technical Algorithm Analysis -- a number-based methodology characterized by the use of trading algorithms –with insight from human psychology and mass behavior that form the foundation of behavioural finance. In its simplest form, technical analysis is the study of supply and demand as expressed in a stock’s price.
Despite a rocky relationship with the financial establishment, technicians are nonetheless a big part of it. There is not a single portfolio manager, trader, speculator or analyst who doesn’t look at charts every day.
I think every investor can benefit from a rudimentary understanding of technical analysis.
Fundamentals of a stock tell us why, while technicals tell us the when and how far it can go.
Fundamentals without Technical is lame, Technicals without Fundamental is blind.
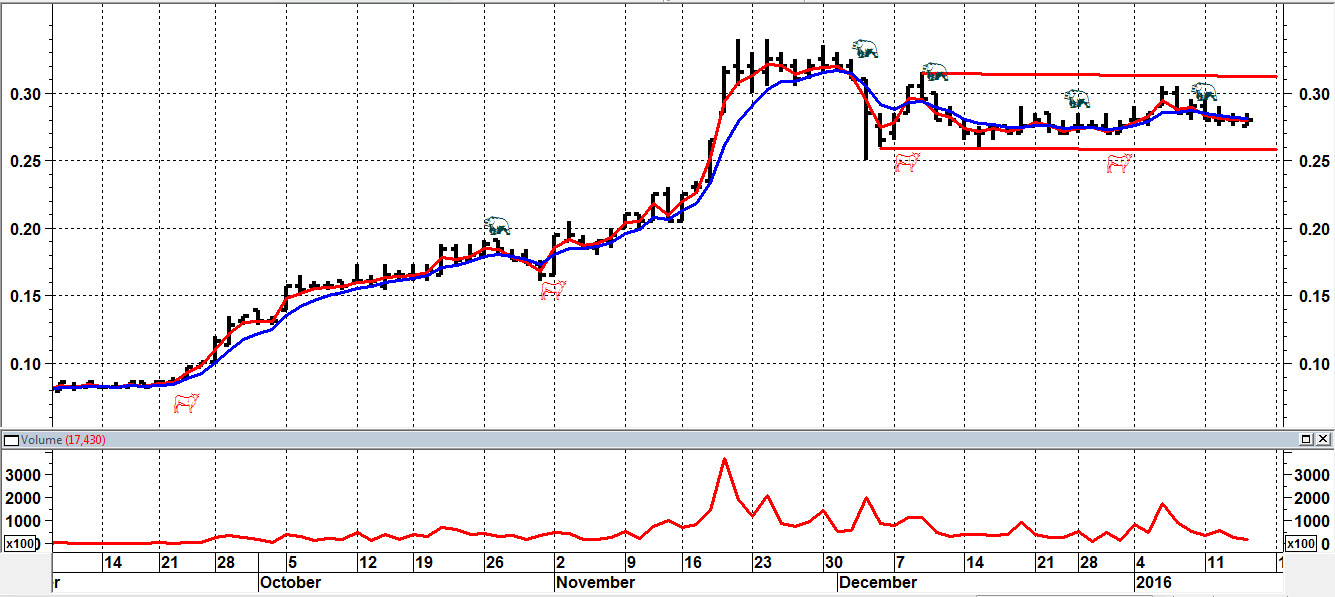
Chart Analysis: The 11-week bullish price rally of INSTACOM started at 8 sens in late-September and peaked at 34 sens in late-November. Two buy-signals and two price-correctional sell-signals or bear-traps were successfully captured by the G.M.TEOH Trend-Tracker, a computer programmed trading algorithm that has no choice but to tune out market noise and just listen to the strength of the price trend.
The bulls and bears in the above chart represent the buy and sell-signals of INSTACOM when the GMT Trend-Tracker algorithm-lines crossed over. The underlying strength of the price surge was evident when the stock price entered into a correctional or profit-taking phase in the last week of October and early-December 2015. In those two bear-traps, the long-liquidation selling volumes were well absorbed by the smart-money and the stock price rallied again subsequently. At that juncture, any intermittent price weakness were bargain-hunting buying opportunities.
Trading over the last six-and–a-half weeks was largely range-bound with prices meandering like a snake within a narrow water pipe. Is this stock now facing overhead resistance or is this a price-support level? These questions would be adequately answered in days and weeks to come. (pls see chart)
Let us take a close look. An upper level price hurdle now stands at the 31.0 sen and support is currently pegged at 26.0 sen. This chart supports appears to be solidly intact. The fact that prices are able to congest on high volume near the upper-end of a major bullish-rally confirmed that the price momentum and underlying technical strength of INSTACOM is constructive. The next big- move which would determine the direction of this stock for the future is more likely to be up than down.
Perhaps, the normal positive trading environment ahead of the Chinese New Year of the Monkey may provide the setting for an upward spurt!
Markets always trade on what that is not priced into markets. Fresh fundamental news in days ahead could fuel the bullish impetus and lift prices higher to establish new rally-highs.
What’s s next? Market intelligence analysis suggests that in the event of a successful upward price breakout at the upper-ceiling of this horizontal band trading resistance level of 31.0 sen, this stock could be transformed into a screaming-buy!
Price Outlook: Based on the algorithm GMTeoh Trend-Tracker and the predictive model of symmetry of second reflection, INSTACOM price would firstly be expected to trend higher in the immediate future to the 35 sen level and consolidate before gathering fresh momentum and track higher on renewed buying to test it near-term price-target at 43 sen. Technical price adjustments are anticipated here on account of another round of healthy profit-taking. Price volatility would emerge from this point on with the daily and weekly trading range widening dramatically.
Continuation of the constructive technical development and bullish sentiment surrounding INSTACOM is expected to intensify towards the second quarter of 2016 and generate further renewed buying interests and help lift prices higher into the 68-70 sen level in the longer term.
The price chart tells no lies. They are the graphic representation of the psychology of the marketplace. Mathematics never lie and neither does price.
Price and Volume Analysis: A two dimensional approach to stock analysis.
INSTACOM had displayed high volume and remarkable sustainable liquidity in its earlier bull-run and also in the consolidation trading over the last six weeks. Liquidity was fluid and with minimum spread differential between the bid and ask prices, enabled short-term traders to jump in and out easily. Low slippage brings down the cost of trading. The rally we witness was a powerful volume-driven rally.
What does the two dimensional approach say about the past and future expectation for this stock? Information known and or anticipated shows up in the price immediately. Price is the only thing that tells you what is. Everything else is what one thinks it should be.
Volume measures the intensity or pressure behind a price trend. The greater the volume, the more we can expect the existing trend to continue rather than to reverse.
Volume precedes price movements – meaning volume would first surge above normal levels to be followed by price advances.
In the case of INSTACOM, the upward rally from 8 sen to 34 sen resulted in a hefty volume of 3.05 billion shares changing hands. This very significant technical development showed that buyers were simply the aggressors as they chased sellers higher and bought huge volume during the course of the rally. This was a classical case of “volume precedes price movements”.
Volume over the last six over weeks totalled 1.43 billion shares. In this price current congestion and accumulation phase, weekly volume has tapered off. Volume basically measures the flow of money (positive or negative cash flow) into and out of a stock.
By monitoring the price trend and volume, traders are better able to gauge the buying and selling pressure behind the impending moves of INSTACOM. The resumption of the upward cycle from here has to be accompanied by a sudden sharp rise in daily or weekly volume to be sustainable. Any substantial increases in volume along with an increase in price is said to confirm the start an upward trend.
In conclusion: If you want to know the past, look at the present which
is the result of it. If you want to know the future, look at the present
which is the cause of it!
Strictly from a Quantitative Technical Algorithm Analysis perspective, INSTACO has the making of a shining star in the Year of the Monkey. It is amazing to see how prices managed to hold with such impressive volumes, just marginally lower from its earlier bull-run peaks. This also solid evidence that this is not a boom and bust speculative-play. The strong technical setting points to a strong possibility of the emergence of a fresh and charging-bull in days ahead.
Be invested. We continue to look forward!
Happy Chinese New Year! Profitably Yours, G.M.Teoh
Note:
G.M.Teoh is an independent market analyst who has successfully defied the conventional wisdom of trading.
His analytical research work on stock market were published by Star Publications weekly under the column name “The Stock Market Signals” from 1986 to 2009. He is currently the chief coach of the Master Trader Tutorial (MTT) conducted in Singapore, Malaysia and Indonesia.
INSTACO (0069) - My Views On Instacom - Salvador Dali
http://malaysiafinance.blogspot.my/2016/01/my-views-on-instacom.html
INSTACO, INSTACO (0069), 0069, EN0069, KLSE:INSTACOM, Investing, Malaysia-Finance Blogspot,
