TGUAN
TGUAN into packaging industry. Past 2 trading days it has show some improvement of trading interest. Therefore, it came to my radar to write a brief story about this counter.
TGUAN into packaging company which their factory located at Kedah. On the other hand, Scientx setup factory at Johor and Malacca. Relatively, Scientx capture the bigger market shares due to the rapid expansion for the past 3 years and this already reflect in the shares price itself. So, some may say I know Scientx is good, but I miss out this counter when it was 5, when it was 6, when it was 7 and so on. So, now take a look of their competitor which is TGUAN. We analyse from the FA point of view then further look into TA CHART. Below is the source I obtain which I believe to be reliable. Kindly double check again with your source.
SCIENTEX TGUAN
EPS 96.20 * 44.62
PE 13.11 7.27 *
DIVIDEND YIELD 1.73% 2.65% *
NET GEARING RATIO 0.13 NET CASH *
INVENTORY CYCLE 28.33 * 95.70
CURRENT RATIO 1.32 3,24 *
NTA 4.62 * 3.75
MARKET CAP 2.926B * 356.868M
TRADE RECEIVABLE 321,215,000 122,087,000 *
Above comparison may not be a complete FA comparison, but it give us some insight how to do comparison among peer in the same industry.
With the rapid expansion of SCIENTX, Scientx already become the market leader of packaging in Malaysia. This directly reflect in the market cap and earning per share. Due to the strong fundamental, SCIENTX already deem to be abit pricey which their PE stood at 13.11 but TGUAN relatively seem to be attractive which is only 7.27. Beside that, investors who look for capital appreciation at the same time look into dividend yield. Obviously, TGUAN at the better hand which provide 2.65% based on historical payout ratio. Both maintain a very low gearing ratio, which mean there will not be any loan repayment issue, TGUAN at the better hand. Net Cash does not mean it good, it also can be look as conservative measurement. So, Net Cash during good economy cycle, it a bad sign meaning you are buying into a company does not take opportunity to expand their market shares and generate more value for shareholders. But, during bad economy cycle which we are talking it right now, so is will be better. At least, we got lesser problem. At least, one problem there will not be any loan repayment issue. Both also stand at very healthy position in term of comparison of CURRENT RATIO. So, TGUAN has a better CURRENT RATIO meaning they got 3.24 time asset to be liquidate in case they need to repay debt. But the way, NET CASH Company does not mean they don’t have bank borrowing. Due to some accounting practice, some corporate borrow loan for some taxing purposes which you better check it out from accountant. Inventory cycle it show that SCIENTX able to control it within a month period of time compare to TGUAN which take approximately 3 month time. It mean that the shorter period if keep in inventory , meaning faster for turnover and good for business. Trade receivable also is important because we sell our good, but does not mean we already collected our money back. So, company has higher trade receivable need to look in depth and closely monitor client repayment history and their business to ensure they able get back their money in time.
Let put some assumption, SCIENTX PE AT 13. TGUAN is a bit slow. How about we put it at PE of 10, what will be shares price look like. PE and EPS for SCIENTX is nearly double of TGUAN and SCIENTX market capital is nearly 7X more than TGUAN. Wow, is it mean is relatively cheap? I am not those FA guy, please forgive me if I am wrong because I focus more than TA.
So, I guess above give you some clue and idea what is going on.
Now, I will look for TA point of view.
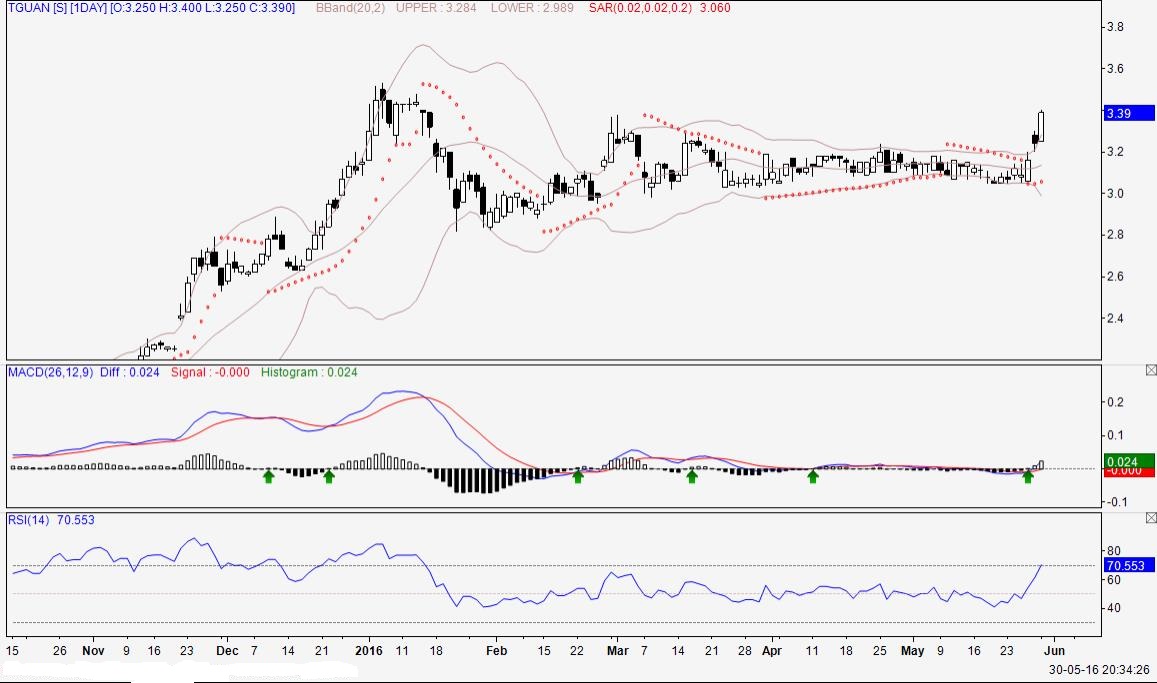
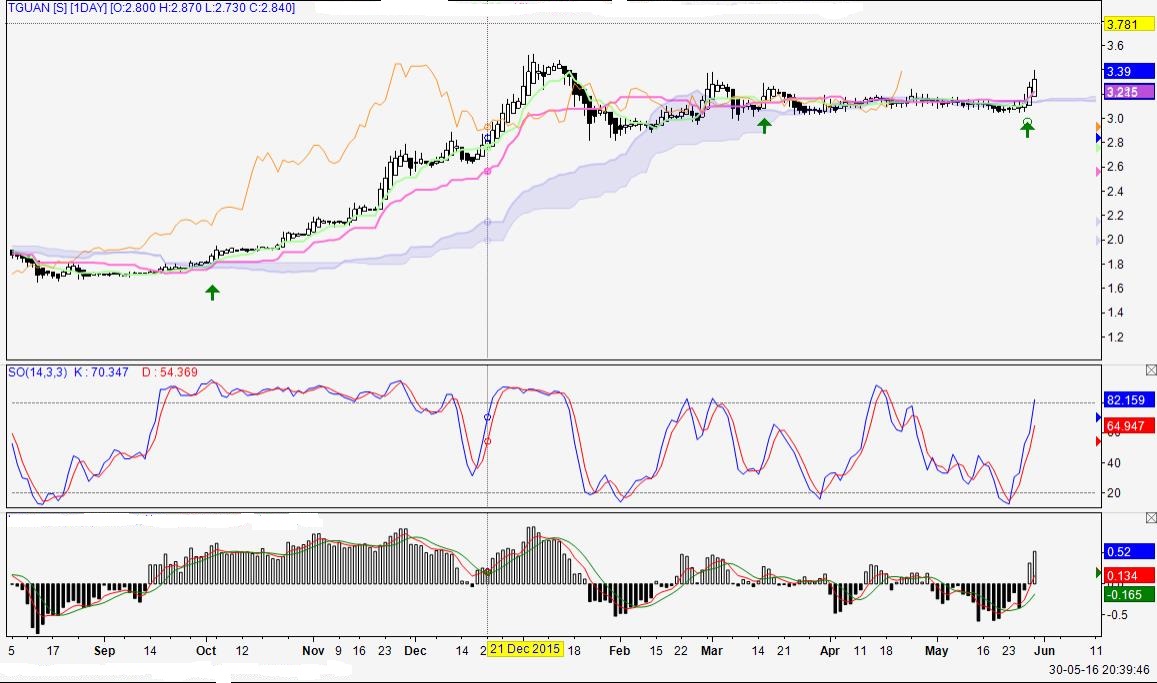
Currently, it hit the first resistance at 3.39 and I believe the momentum will still carry on to touch historical high at 3.54. Shall it able to break new high, based on technical breakout projection, it given me the next target price level at 3.95.
If use Fibonacci projection, it give me the first resistance at 3.82 follow by 3.99. So, 3.95 and 3.99 which one to choose. Sure to choose the lower one because who know it hit and start U-TURN. Then, we just can say so sorry when we aim so high. Chinese got a phrase saying that “ CLIMB UP HIGHER, WHEN DROP IT EVEN MORE PAINTFUL”
If we look at MACD, it generate a positive signal. RSI as well. Bollinger band expanding with positive movement,same go for PARABOLIC SARS. Even price volume behavior also look good.
Trading Investment (TI)
Trade with wisdom ;
House of Happiness;
SMART MONEY ;
TREND FOLLOWER
Stay Tune and follow https://telegram.me/tistock
Disclaimer: Above information obtain at the best available source of information. Any inaccurate information, writer should not held any responsibility due to investment losses arise from above article. It does not solicit buy or sell call on the stock, it merely for educational sharing purpose. Kindly consult your investment broker pertaining any investment decision.
TGUAN (7034) - Stallion Stock Pick 31 May 2016 : TGUAN
http://klse.i3investor.com/blogs/SICStockPick/97526.jsp
