TEKSENG (7200) - If You Miss The Entry 10 Days Ago, Your Second Chance Might Be Here - TEKSENG Bullish Flag Breakout
TEKSENG (7200): Bullish
Pattern: Breaking Out From A Bullish Flag Plus A Double Bottom
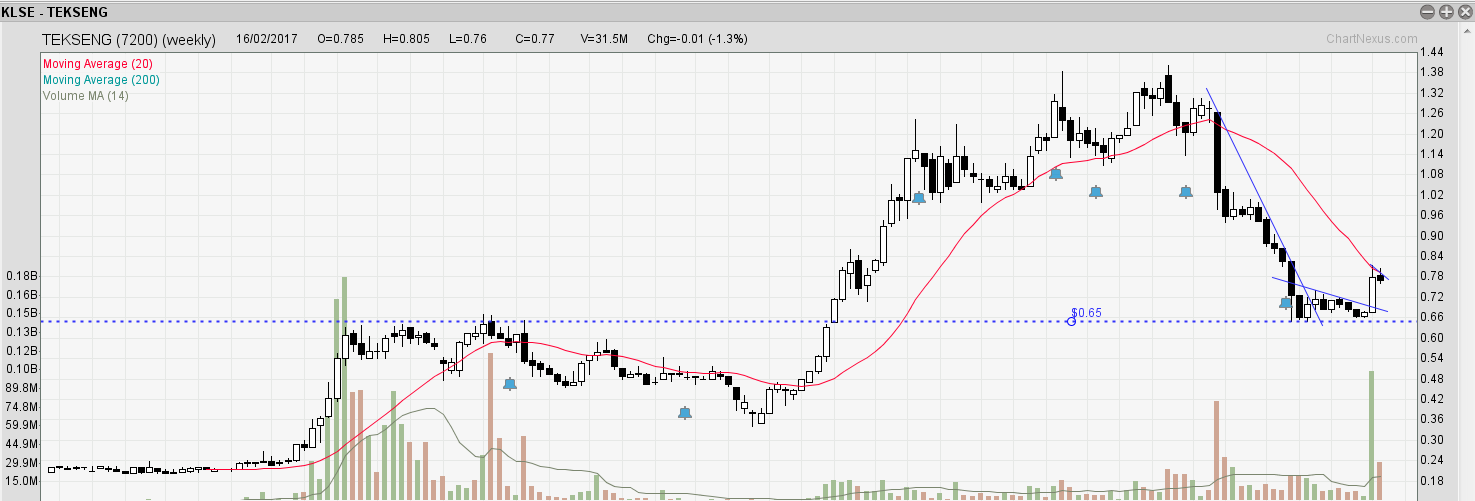
Based on TEKSENG's weekly chart above, we can notice that TEKSENG rebounded from a resistance-turned-support line at 0.65 with high volume.
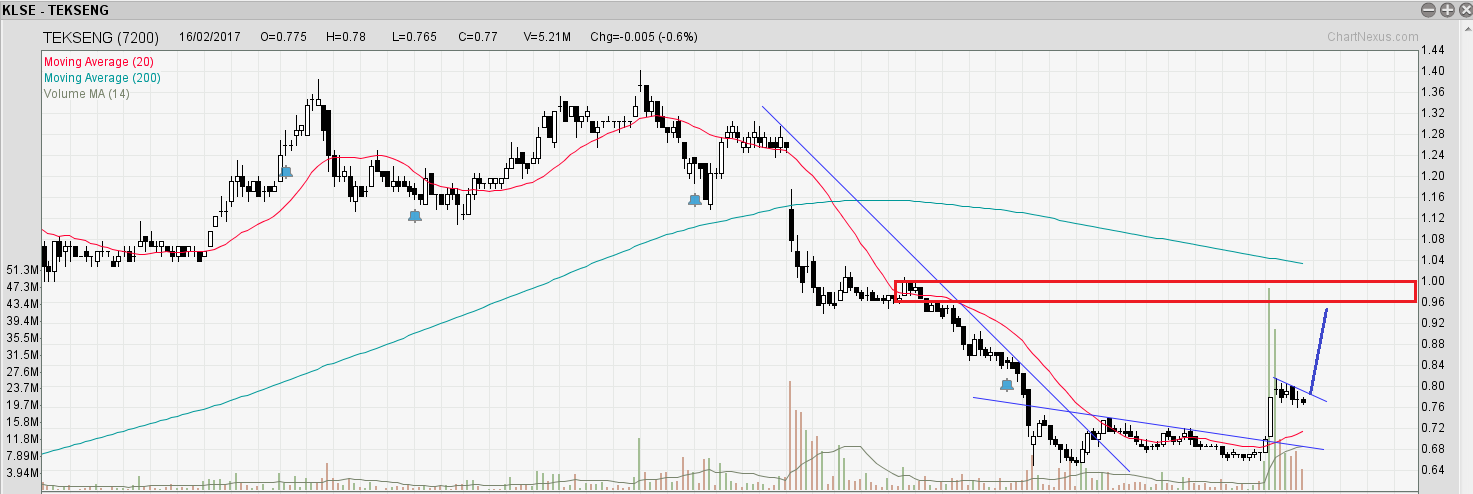
On the daily chart above, TEKSENG forms a double bottom and broke out from those two downtrend lines. The first entry will be the bullish candle breakout 10 days ago. If you missed it, it is currently breaking out from a bullish flag with decent volume. The projected target price is 0.95, which is just below the overhead resistance as marked in a red box.
I stay bullish on TEKSENG as long as it is above 0.75.
Leave me a comment below and let me know what you think. If you have any queries or want to share the next big stock with me, feel free to contact me via my email or FB page below.
Topics That You Do Not Want To Miss
The Trade Management Technique You Need To Know - http://klse.i3investor.com/blogs/candlestick/114496.jsp
Best Way To Learn To Trade Without A Mentor - http://klse.i3investor.com/blogs/candlestick/113821.jsp
Come Up With Trading Ideas & Turn Them Into Investing Ideas - http://klse.i3investor.com/blogs/candlestick/114110.jsp
Cheers,
Ming Jong
Get Update From ==> http://www.vipplatform.com/lp/ideas/
& FB page ==> https://www.facebook.com/BursaSGXcandlestick/
Contact Via Email ==>
TEKSENG (7200) - If You Miss The Entry 10 Days Ago, Your Second Chance Might Be Here - TEKSENG Bullish Flag Breakout
http://klse.i3investor.com/blogs/candlestick/116132.jsp
