AZRB (7078) - AZRB Trade The Bullish Flag Breakout Plus A Break & Retest Pattern
AZRB (7078): Bullish
Pattern: Bullish Flag Breakout
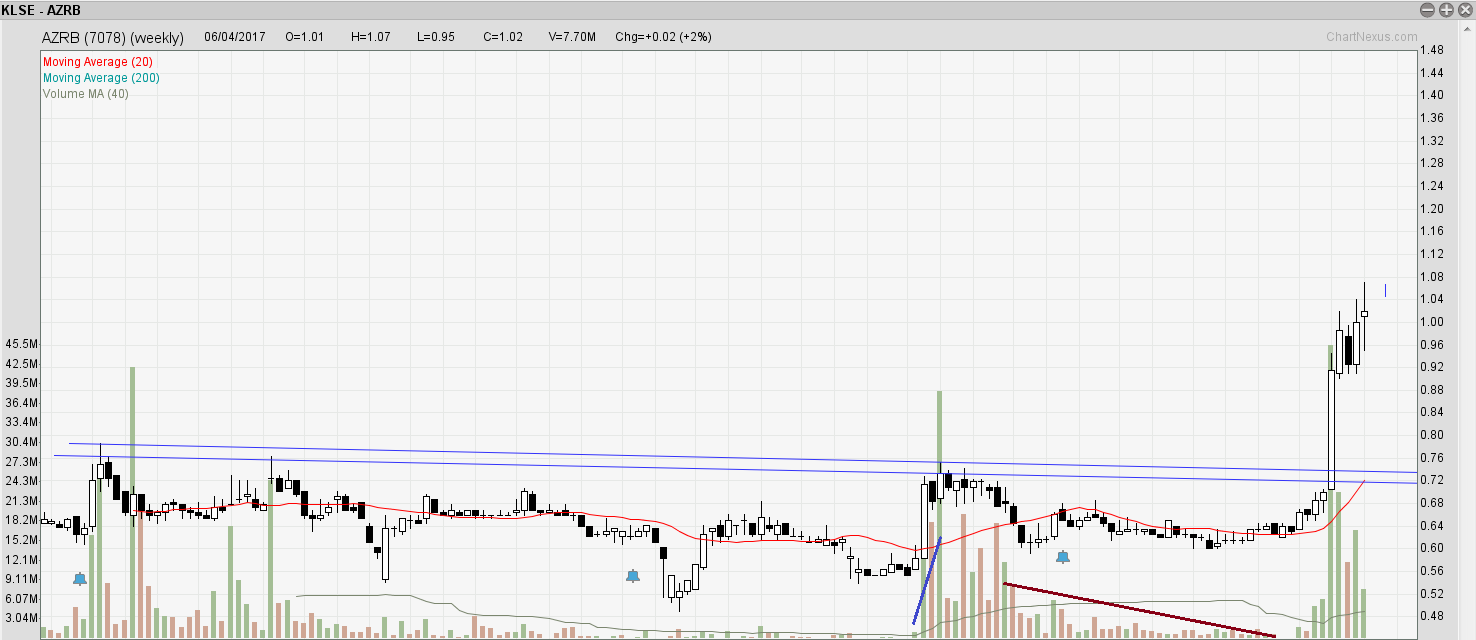
From AZRB's weekly chart above, we can see that after almost a 3 years consolidation, AZRB finally broke out of the resistance in early of March 2017 with strong volume and great bullish candle.
The volume flow based on the weekly chart is very healthy and is a relatively safe bet for a sustainable uptrend.
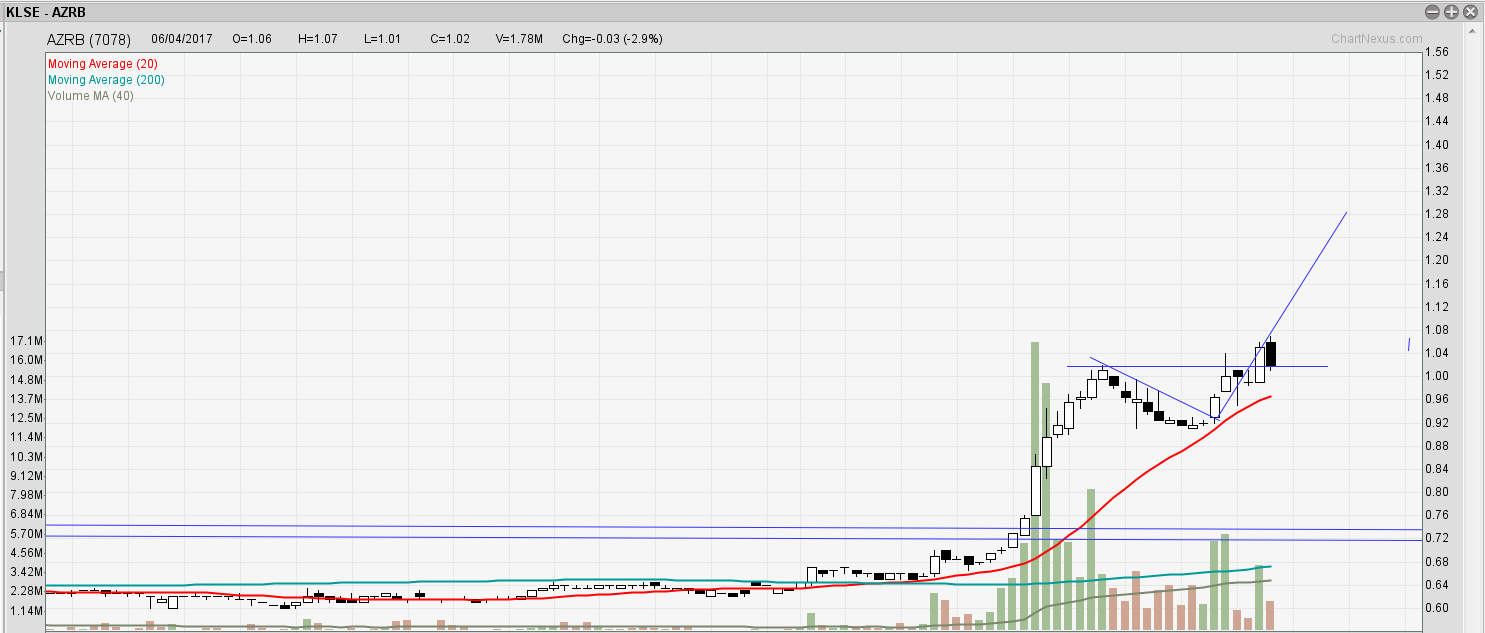
As shown in AZRB's daily chart above, after the impulsive movement breaking out of the long-term resistance, the price pullback and a bullish flag is formed. Subsequently, AZRB broke out from the flag and the 52-weeks high, followed by a retest based on today's price action.
A break and retest pattern could be a good entry for AZRB.
However, do note that this pattern will only be valid when the candle bounces up from the resistance-turned-support. Else, it might turn out to be a false break.
The target prices for AZRB are 1.16, 1.28 and 1.50.
If are aggressive and familiar in warrant, AZRB-WA can be used as a proxy for trading.
I am bullish on AZRB as long as it stays above 0.90.
Leave me a comment below and let me know what you think. If you have
any queries or want to share the next big stock with me, feel free to
contact me via my email or FB page below.
Topics That You Do Not Want To Miss
The Trade Management Technique You Need To Know - http://klse.i3investor.com/blogs/candlestick/114496.jsp
Best Way To Learn To Trade Without A Mentor - http://klse.i3investor.com/blogs/candlestick/113821.jsp
Come Up With Trading Ideas & Turn Them Into Investing Ideas - http://klse.i3investor.com/blogs/candlestick/114110.jsp
Cheers,
Ming Jong
Get Update From ==> http://www.vipplatform.com/lp/ideas/
FB Page ==> https://www.facebook.com/BursaSGXcandlestick/
Telegram Channel ==> https://t.me/BursaSGXCandlestick
Contact Via Email ==> 
AZRB (7078) - AZRB Trade The Bullish Flag Breakout Plus A Break & Retest Pattern
http://klse.i3investor.com/blogs/candlestick/120079.jsp
AZRB (7078) - AZRB Trade The Bullish Flag Breakout Plus A Break & Retest Pattern
http://klse.i3investor.com/blogs/candlestick/120079.jsp
