
公司简介 (Company Brief)
- VIS从事自动化测试设备的制造,为半导体组件和测试提供设备解决方案
- 成立于2003年,总部位于马六甲Ayer keroh
- 产品包括
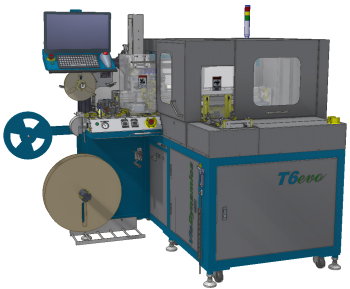


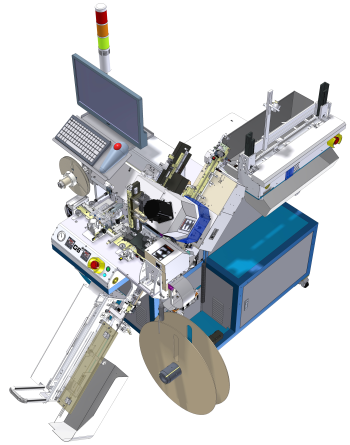
- Tray Scanning with tape and reel systems
- Tray-tape and reel inspection system
- Rotary gravity feed electrical test
- Vision Inspection
- Taping System
- 产品销售于马来西亚,Southeast Asia ,North Asia & US
财报摘要 (Financial Highlight)
Price
|
1.24
|
PE
|
19.64
|
Shares
|
110,695,000
|
Mkt Cap
|
137 m
|
2013
|
2014
|
2015
|
2016
|
17T4Q
| |
Revenue ('000)
|
3,623
|
16,116
|
9,434
|
27,468
|
34,623
|
EBIT ('000)
|
(2,453)
|
1,251
|
(716)
|
5,466
|
8,332
|
Net Profit ('000)
|
(2,395)
|
1,241
|
(664)
|
4,292
|
6,988
|
EPS
|
-2.39
|
1.24
|
-0.60
|
3.88
|
6.32
|
DPS
|
N/A
|
N/A
|
N/A
|
N/A
|
N/A
|
Net Profit Margin
|
-66.11%
|
7.70%
|
-7.04%
|
15.63%
|
20.18%
|
ROE
|
-14.72%
|
7.09%
|
-3.42%
|
18.10%
|
26.84%
|
Cash and Bank Balances ('000)
|
2,209
|
3,873
|
5,219
|
10,566
|
7,471
|
Total Borrowings ('000)
|
368
|
2,519
|
832
|
2,825
|
2,936
|
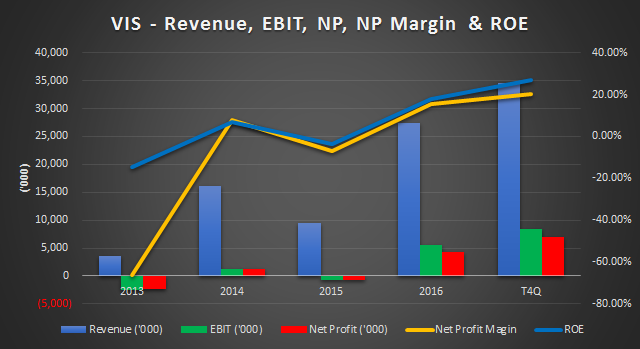
- VIS的Revenue从2013年至2015都处在不稳定的状况。2014年出现暴增后,在2015年Revenue又开始下跌。2013和2015年公司都在亏钱。直到2016财政年,公司的Revenue,net profit 和 profit margin大大增高。
- 2016的财年的收入和盈利也是VIS做过最后好的业绩。
2016 Q1
|
2016 Q2
|
2016 Q3
|
2016 Q4
|
2017 Q1
|
2017 Q2
| |
Revenue ('000)
|
4,214
|
3,441
|
8,071
|
11,741
|
6,048
|
8,763
|
EBIT ('000)
|
256
|
(7)
|
1,988
|
3,284
|
1,098
|
1,962
|
Net Profit ('000)
|
241
|
(66)
|
1,974
|
2,147
|
1,122
|
1,745
|
EPS
|
0.22
|
-0.06
|
1.78
|
1.94
|
1.02
|
1.58
|
Net Profit Margin
|
5.72%
|
-1.92%
|
24.46%
|
18.29%
|
18.55%
|
19.91%
|

- 2016 Q1 & Q2, 公司的业务都表现平平,在16Q2也出现亏损。但从16Q3开始,公司业务开始发酵,连续两个季度都出现高增长。到了17Q1 和 Q2, 公司的业绩依然保持着,net profit margin介于18%左右。
- Annual Report

2016 Q3 Quarter Report

- Quarter Report
- 可以从公司的季报和年报了解到,基于半导体工业的增长,而且美国,亚洲区域估计将会拥有最高的成长空间。这正是公司产品主要的销售的国家以及区域。加上公司将会推出新产品,对2017年的展望是非常乐观的。
Chart

- 自从VIS 16Q2交出漂亮的成绩单后,股价开始直线上涨。今年年头股价为0.355最高价去到1.28,那么股价涨幅相等于260% !
财务状况 (Financial Position)
T4Q
| |
Liquidity Ratio
| |
Current Ratio
|
1.33
|
Quick Ratio
|
2.49
|
Solvency Ratio
| |
Debt to Equity
|
0.43
|
Debt to Asset
|
0.30
|
Financial Leverage
|
1.43
|
Profitability Ratio
| |
GP Margin
|
62.41%
|
NP Margin
|
20.18%
|
Asset Turnover
|
0.88
|
- 公司的Liquidity ratio 和 Solvency Ratio属于良好水平,现金也多过borrowings属于net cash company。
- 在赚幅方面,公司的gross profit margin是 62%而net profit margin为20%,这是非常不错的profit margin,而且资产回报率也是很高的,
FY17 Q3 & Q4 业绩展望
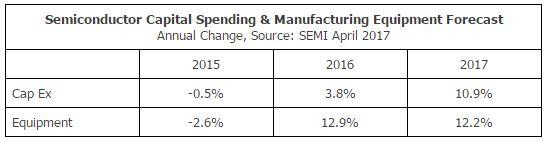
- 2017年半导体行业大都交出漂亮的成绩单,据Gatner和SEMI研究,半导体行业在2017年的Capital Spending和 Equipment Spending 估计会有双位数的增长
- 在大环境的利好因数下,笔者相信VIS在来临的Q3&Q4还是会交出不俗的业绩。
Worldwide Semiconductor Capital Spending and Equipment Spending Forecast, 2016-2020
(Millions of Dollars)
(Millions of Dollars)
2016
|
2017
|
2018
|
2019
|
2020
| |
Semiconductor Capital Spending
|
70,568.9
|
77,794.5
|
77,443.5
|
71,814.8
|
73,239.5
|
Growth (%)
|
9.1
|
10.2
|
-0.5
|
-7.3
|
2.0
|
Wafer Fab Equipment, Including Wafer-Level Packaging
|
37,033.1
|
43,661.0
|
43,690.4
|
40,515.8
|
41,342.7
|
Growth (%)
|
11.4
|
17.9
|
0.1
|
-7.3
|
2.0
|
Other Semiconductor Capital Spending
|
33,535.8
|
34,133.5
|
33,753.2
|
31,299.0
|
31,896.8
|
Growth (%)
|
6.8
|
1.8
|
-1.1
|
-7.2
|
1.9
|
Source: Gartner (July 2017)
By: 十里
16/8/17
Note
以上纯属个人分享及意见,并没有买卖建议。
http://tenmilesinvestment.blogspot.my/2017/08/vis-260.html
http://tenmilesinvestment.blogspot.my/2017/08/vis-260.html
