IGBREIT (5227) - IGB REIT Performance Against Peers (KLSE:5227)


#1. Rental Yield
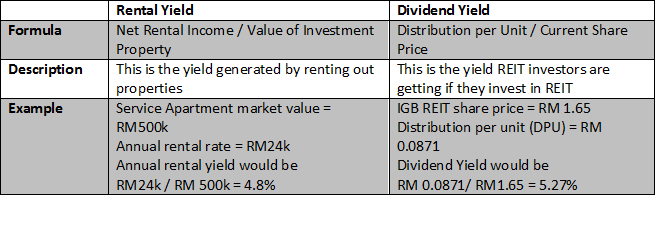
Rental Yield shows the rate of return a property is likely to generate out of its rental income if you invest in the property at current market value. To simplify this, this is the same as you buying a house and renting it out. The rental collected divided by the current property value gives you rental yield.
In REITs, investor should not be confused with Rental Yield and Dividend Yield. The table below shows both yields have very distinct differences:
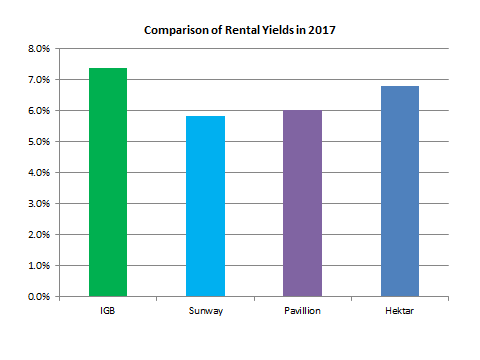
Having Midvalley and The Gardens mall as IGB REIT’s main revenue contributor, it has steady and increasing Property Rental Yield from 5.9% in 2013 to 7.4% in 2016 due to location [insert hyperlink] . Besides that, IGB REIT has the highest yield in the recent financial year compared to Sunway, Hektar and Pavilion REITs. This is mainly due to organic growth in Midvalley and The Gardens which includes positive rental reversion and increase in both occupancy rates & Net Lettable Area (NLA).

Debt ratio calculates the proportion of a REIT’s total assets that is funded by debt (i.e. bank borrowings). In other words, it shows how highly geared a company is. The higher the Debt ratio, the more leveraged the company is, implying greater financial risk. But what level of Debt ratio is considered as high or low? In order to determine this, we need to compare IGB REIT against its peers.
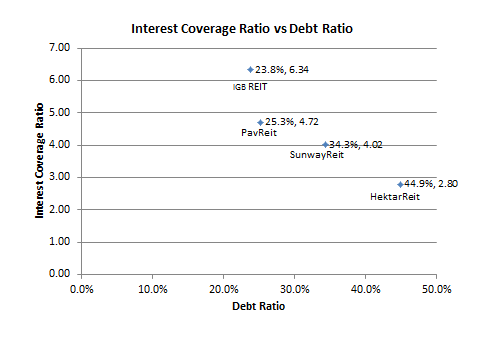
Interest Coverage Ratio is used to determine the ability of a company in servicing its interest expenses on outstanding debt
Interest Coverage Ratio = Operating Profit before changes in working capital / Interest Expense.
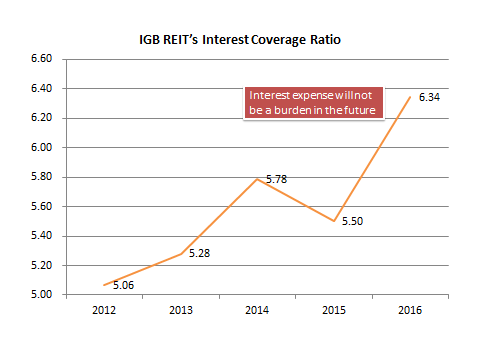
IGB REIT again has the highest interest coverage ratio of 6.34 times
among its peers with the lowest interest coverage ratio being Hektar
REIT having only 2.8 times its operating profit. In other words, IGB
REIT has less debt expense burden compared to Hektar REIT. Both the debt
ratio and interest coverage ratio shows IGB REIT has a healthier
financial position among its peers.#3. Historical Dividend Yield
As discussed earlier, the main reason investors invest in REITs is because REITs give us high dividend plus potential capital appreciation. Since REITs are required by the Malaysian law to distribute at least 90% of their taxable income to its unit holders every year, it tends to be among those companies that pays the highest dividends. This is because REITs have a relatively stable and predictable stream of contractual rental income paid by the tenants who occupy the REIT's properties.
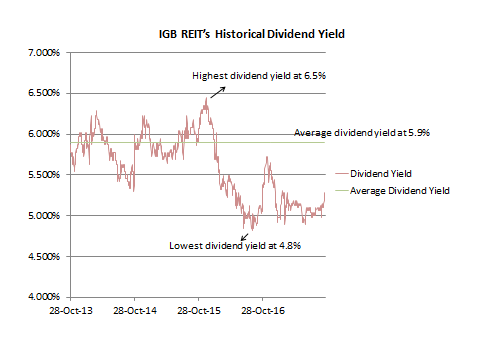
By analysing the IGB REIT’s historical dividend yield, I find that the highest yield is 6.5% in early 2015 and lowest yield 4.9% in late 2015. The average yield from 2013 till date stands at 5.9%. The decrease in dividend yield in 2015 is due to increase in share price as investors has been optimistic with IGB REIT’s performance and are willing to pay premium for expected higher DPU in future.
In order for me to know whether the financial performance of IGB REIT is good or bad, I need to perform a peer analysis because every industry has its own characteristics. Under Malaysia REITs, there are five categories of REITs namely Retail, Industrial, Hospitality, Healthcare and Office. A disruption caused by e-commerce may affect the retail REITs but it may not affect so much on Industrial REITs. We cannot compare retail REITs with industrial REITs simply because both are in a very different industry. As such, by comparing apple-to-apple I will get a better picture of how these REITs behave with the changing economic environment that they are operating in.
No doubt IGB REIT has the best property rental yield, interest coverage ratio and lowest debt ratio, but investors should be mindful that there are always business, market and investment risk. To protect us against these risks, investors must apply some ‘margin of error’ before purchasing a company.
“Superior investors know – and buy – when the price of something is lower than it should be. When prices are low, the potential return is high” – Norman.Y
You can also view our other insights (http://www.stocksinsights.com/)
http://klse.i3investor.com/blogs/IntelligentContrarians/137873.jsp
