After six months of correction, FBMKLCI finally reversed and showed some early signal of new uptrend.
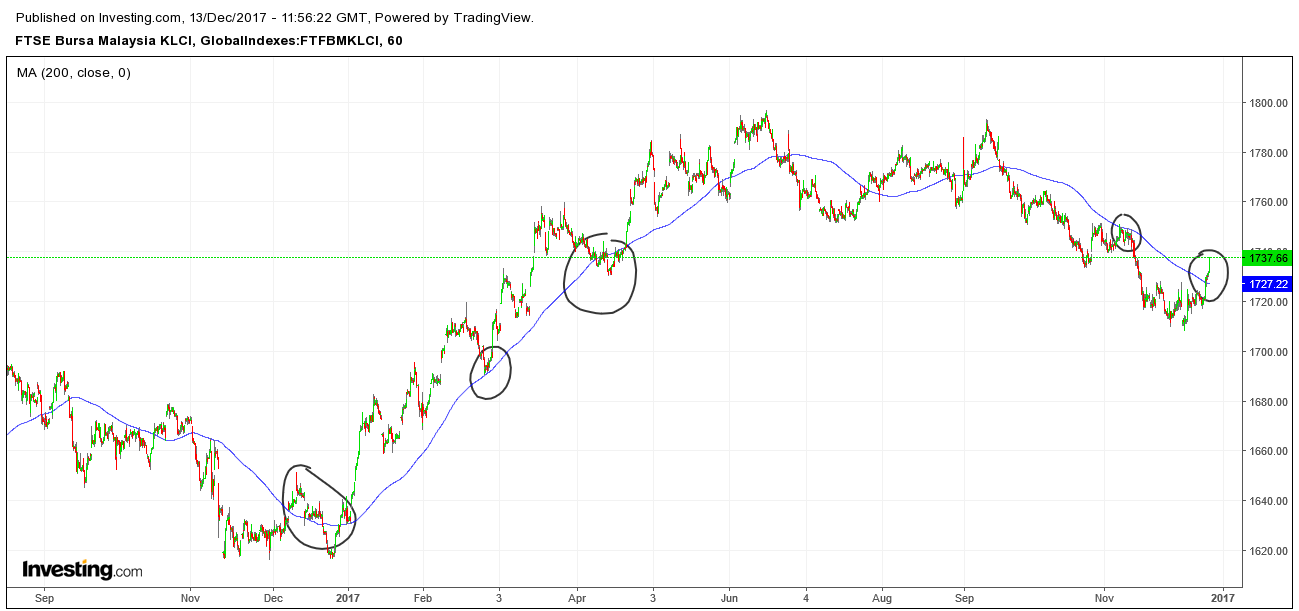
Take a look at the FBMKLCI hourly chart above, FBMKLCI finally closed signifcantly above hourly 200ma.
This is a testament of intention to embark a strong uptrend, and the bullish upmove we saw these two days was legitimate.
The circled regions in the chart show the function of hourly 200ma as the boundary that seperates bull and bear territory, as price tends to bounce off 200ma.
Look at the first circle on the left, FBMKLCI breaks up from 200ma and retested it before commencing the uptrend we saw in 1H 2017.
Then in early November 2017, FBMKLCI retested and failed to break above hourly 200ma, hence the price corrected down afterwards.
Yesterday and today, we can observe a convincing closing above the hourly 200ma, so this is an early sign that the long dreaded correction in 2H 2017 is finally coming to an end. The uptrend and bull run of FBMKLCI is expected to resume after the 6 months hiatus.
Final confirmation of uptrend will be completed when FBMKLCI bounces off hourly 200ma in the future.
If you are not convinced on why FBMKLCI should rally, please refer back to my previous article.
http://klse.i3investor.com/blogs/Tech_Watch/141387.jsp

