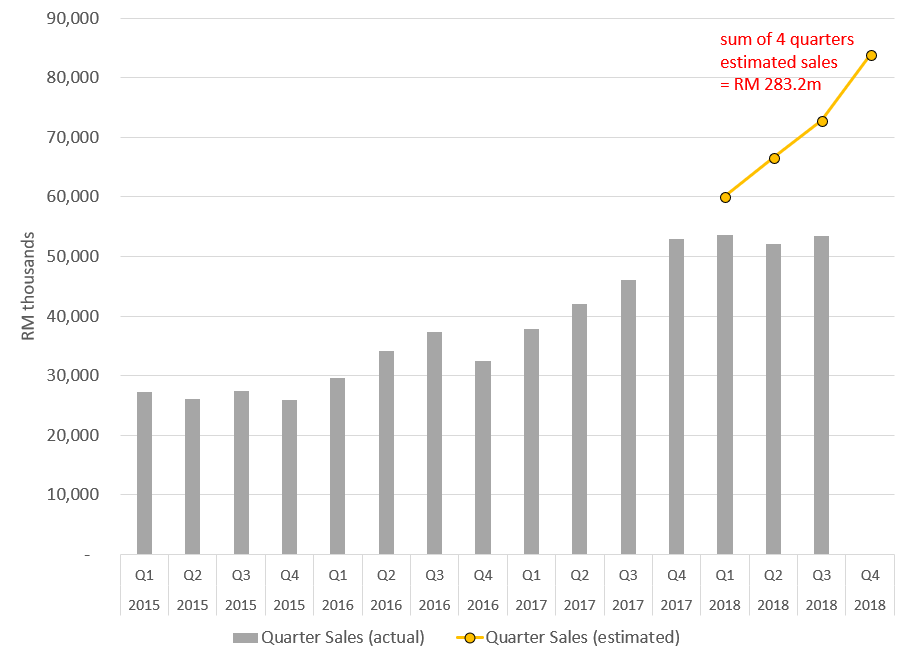
- Sales in the last three quarter flatten while productive assets is historically high
- Historically low asset productivity (EPM assets turnover is estimated to be 3.73 only)
- Something is very wrong and SCGM management should tell us more about this
Much discussions on recent financial results of SCGM have been focused
on material costs and gross profit margin. While these metrics are very
important in measuring financial performance, they are not really under
control by the management in the short run. In the long run, material
cost increase will gradually pass to the consumers. When Maersk Line raises shipping rate driven
by bunker price surge, consumers have to prepare to pay more for their
goods. Rather, I would concern more on sales growth of SCGM.
Sales growth not materialized
Last summer, I applied a capacity-led growth model and
attempted to project future sales of SCGM based on its guidance on
capital expenditure on equipment, plant and machinery (EPM). The
estimated sales of FY2018 is RM 283.2m. Since then, three quarters have
passed and its sales did not pick up as projected. Something is very
wrong. But what is it?

Historical low EPM assets turnover
Sales was projected based on a simple relationship. In particular,
Sales (FY2018) = EPM assets (FY2017) * EPM assets turnover
From the balance sheet of FY2017, EPM assets was RM 57m. For EPM assets
turnover, Hau’s view assumed it to be 5.0 in last July. Accordingly,
sales was projected to be RM 283.2m. However, the last three quarter
sales flatten; if this trend continues, EPM assets turnover would be
estimated to be 3.73 only! It is much lower than the historical low of
4.48 in the past ten years.


We can expect SCGM management should tell us more about what has
happened in the coming final results announcement. Meanwhile, I will try
to analyse and list the possible causes of so low asset productivity in
my next post.
Disclaimer
All articles in this blog are intended
for research and educational purposes only. Materials in these articles
including, but not limited to, graphs, tables and screen shots
featuring investment data are not recommendations to buy or sell. The
investment analysis, information, and related comments may be
out-of-date when you read them. You should do your own due diligence
into any investment before making the decision to buy or sell. While we
aim to provide accurate data to assist you in performing your stock
valuation, we do not take responsibility of any inaccurate or omitted
data. Please verify them. We are not liable for your investment losses.
http://klse.i3investor.com/blogs/hautoinvest/158579.jsp
http://klse.i3investor.com/blogs/hautoinvest/158579.jsp
