There is many people has been posting on Jaks should buy or sell. So, there is mix signal which lead to the argument whether to buy or sell. Since there is noise, i choose to interepret base on technical point of view.

what you can see the two blue color trend which i plot the difference showing 0.905 and 1.00 which is much telling much on the upside price movement .
Where there is correction from 1.28 to 0.8.
Pull back percentage : (1.28 - 0.8)/ 1.28 * 100 = 37.5%
Second part of calculation which the peak at 1.80
Pull back percentage : (1.80 - 1.10 ) / 1.80 * 100 = 38.9%
What this calculation show it to you is there some sort of correlation of the price movement which telling you where is the upside and pull back phase.
Now, we will look into support resistance to know where are we standing rite now. What are the risk/reward ratio?
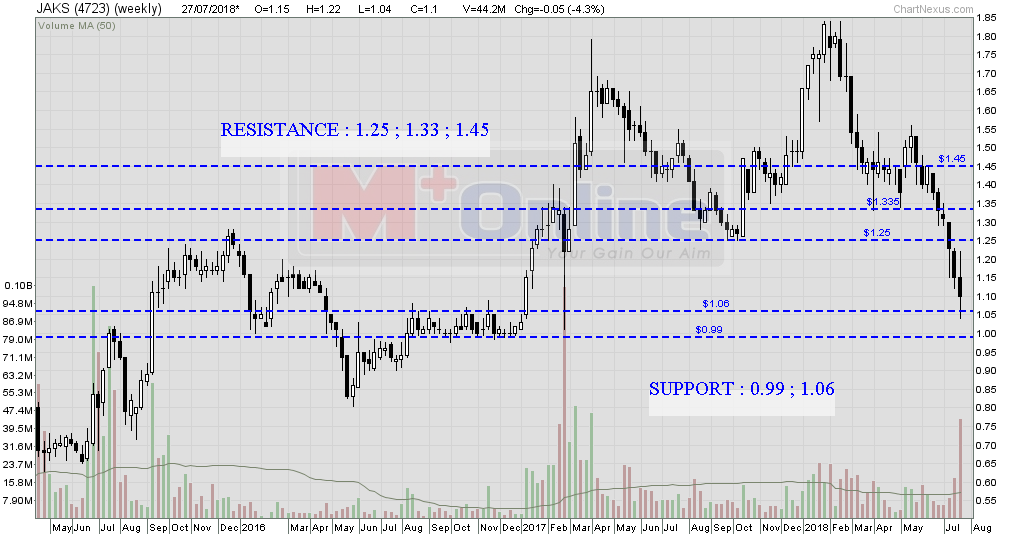
SUPPORT : 0.99 ; 1.06
RESISTANCE : 1.25 ; 1.33 ; 1.45
Trading Plan : As long it hold above 1.06, those trader can look into it, once it break then next support level to watch out is 0.99. Once it break, then it should be further down all the way.
Assume Entry at 1.13, return in term of percentage if hit resistance level at 1.25 (10.6%) , 1.33 (17.7%) , 1.45 (28.3%)

Look into 28 Feb 2018, there is sudden sell down with huge selling pressure which contribute 46.93m shares traded in a day which is nearly 8.5% turnover.
As of Friday closing, it appear similiar pattern compare to the 28 Feb 2018. but what different is one is bullish candlestick reversal pattern occur in the year 2017 but 27 July 2018 also show recovery but it still a negative closing candlestick which telling us the momentum of the recovery is not that strong compare to the year of 2017 eventually break the earlier high and trend up higher. For this case, it will be merely on the technical rebound instead of strong recovery. Those who has bought earlier, base on technical reading it should be sell on strength if you have been trap earlier. Reversal signal will only come in base on chart reading is when it go above 1.18 for Jaks.
Again, many people alway like to ask what if break 0.99. Where is the next support?
In this case, i adopt Fibonacci Retracement which give me the next support shold be peg 0.94. Once it break then next Fibonacci level will be 0.725.
Conclusion, there is many uncertainty and this counters has been surrounded by many negative news which possible limit the upside. Those who wish to trade on potential rebound better keep your profit margin low else you might be get trap eventually.
If I am trader, I would monitor the buying interest in the morning, if the first 5 minute is strong buying interest and never really gap up much, then we may consider taking position but if there is mix signal occur. I would rather focus on other stock instead of this. why so stubborn enter into this while there is plenty of better trading stock compare to Jaks unless you plan to buy and keep it.
Conclusion : Investment may not be a wise decision at this juncture as there is many negative news, but risk taker alway earn the most if your view is correct. Where else for me, I would rather stick to technical trading view or look for better stock instead of Jaks.

Disclaimer : Above is my personal point of view. Trade at your own risk.
FB : https://www.facebook.com/Steventheeinvestment/
Telegram : https://t.me/steventhee628
http://klse.i3investor.com/blogs/SICStockPick/167299.jsp
