I start it with interesting chart. It come with 2 side of views.
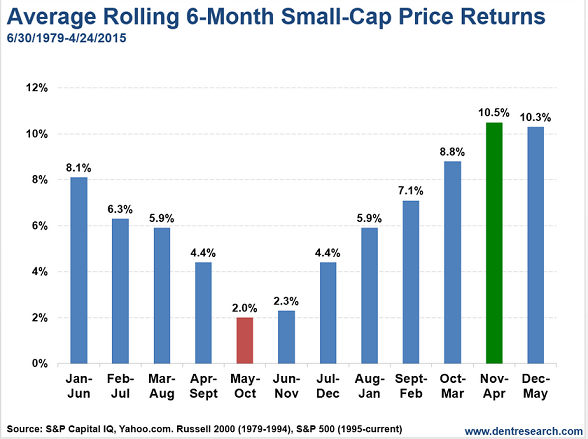
1st with S&P 500 average rolling. http://ekonomiorangwarasdaninvestasi.blogspot.com/2016/05/sell-in-may-and-go-away.html
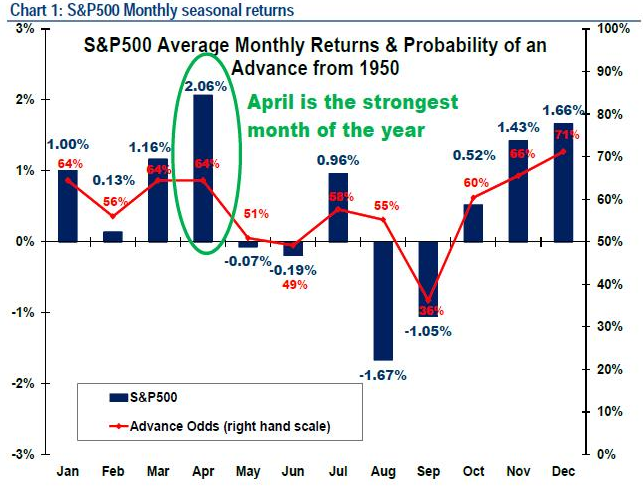
2nd https://www.zerohedge.com/news/2018-05-07/trader-why-sell-may-may-be-delayed-year
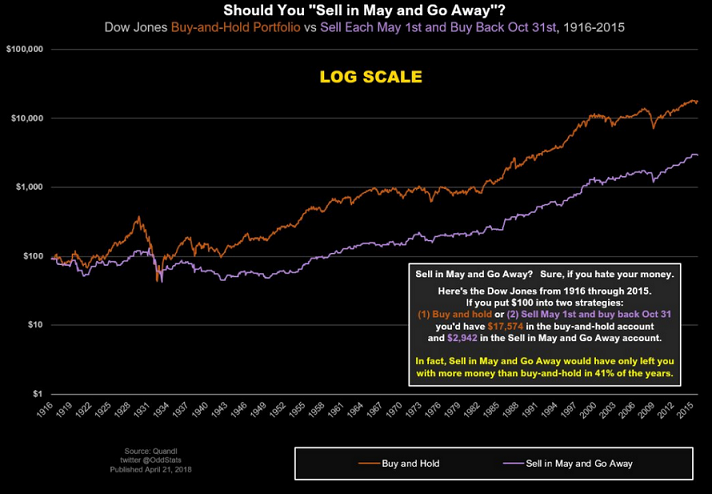
3rd Show some positif data for who want to continue invest in May
https://bullmarkets.co/study-why-you-shouldnt-sell-in-may-and-go-away/
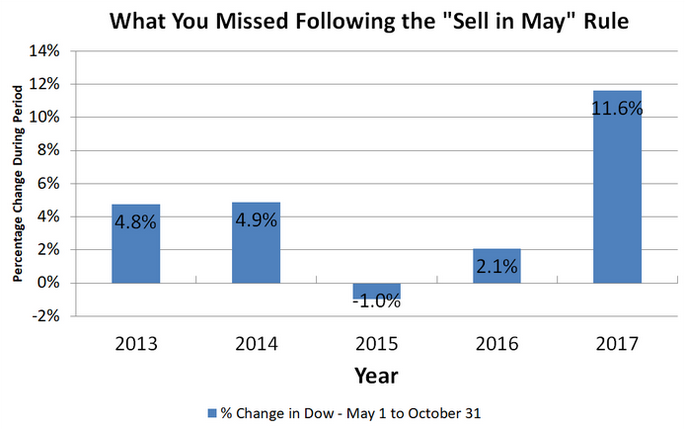
4th https://www.fool.com/retirement/2018/04/23/a-foolish-take-should-you-sell-in-may-and-go-away.aspx
Below is KLSE data taken by me form 1994 until 2014

Please read my previous post (*inside got many seniors and pro/ sensei advise, example Ooi Teik Bee in comment)
https://klse.i3investor.com/blogs/Backtesting/85101.jsp
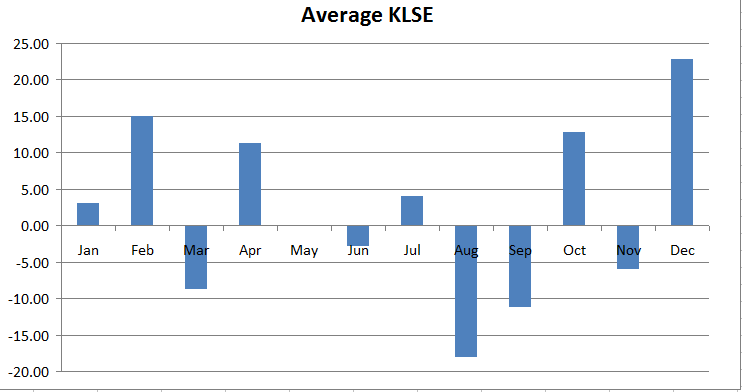
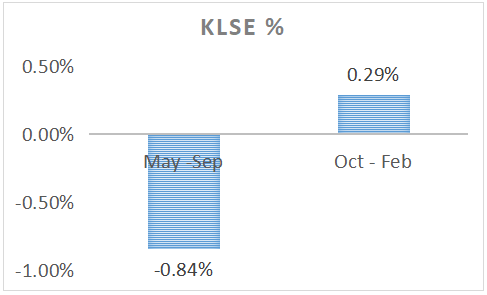
How about our KLSE results from Mar 2015 until Feb 2019??
=.=... The KLSE results no good and follow "Sell in May formula"
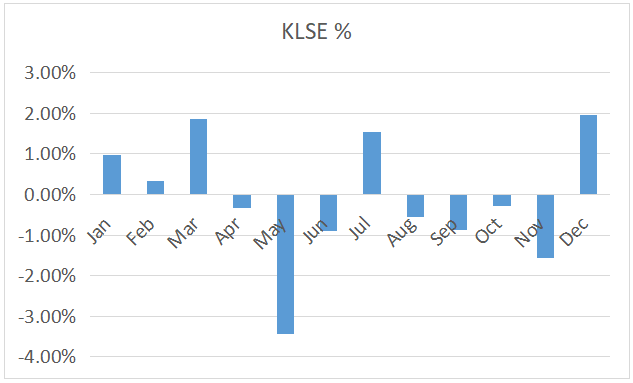
Jul and Dec are good months. After check 1994 until 2014 monthly and Mar 2015 - Feb 2019 chart
Which action your taken? Please leave comment.
A) Sold big amount of they share and keep they cash.
B) Buy more share due to "buy low sell high" concept.
C) Don't care about this. My buy sell fundamental, just wait and see the quarter report results.
D) Don't care about this. My buy sell base on tips.
E) Don't care about this. My buy sell base on chart or technical.
F) Other (please leave it in comment, I will update here)
All friend, senior, sifu, pro or sifu, your comment are welcome and thanks for reading it.
I wish our new government doing something for our economic (In May 2019 we will review the results after they takeover)
**Just sharing as study case and take your own risk to use it in your investment.
If you need the data, check below:
1st with S&P 500 average rolling. http://ekonomiorangwarasdaninvestasi.blogspot.com/2016/05/sell-in-may-and-go-away.html
2nd https://www.zerohedge.com/news/2018-05-07/trader-why-sell-may-may-be-delayed-year
3rd Show some positif data for who want to continue invest in May
https://bullmarkets.co/study-why-you-shouldnt-sell-in-may-and-go-away/
4th https://www.fool.com/retirement/2018/04/23/a-foolish-take-should-you-sell-in-may-and-go-away.aspx
Below is KLSE data taken by me form 1994 until 2014
Please read my previous post (*inside got many seniors and pro/ sensei advise, example Ooi Teik Bee in comment)
https://klse.i3investor.com/blogs/Backtesting/85101.jsp
How about our KLSE results from Mar 2015 until Feb 2019??
=.=... The KLSE results no good and follow "Sell in May formula"
Jul and Dec are good months. After check 1994 until 2014 monthly and Mar 2015 - Feb 2019 chart
Which action your taken? Please leave comment.
A) Sold big amount of they share and keep they cash.
B) Buy more share due to "buy low sell high" concept.
C) Don't care about this. My buy sell fundamental, just wait and see the quarter report results.
D) Don't care about this. My buy sell base on tips.
E) Don't care about this. My buy sell base on chart or technical.
F) Other (please leave it in comment, I will update here)
All friend, senior, sifu, pro or sifu, your comment are welcome and thanks for reading it.
I wish our new government doing something for our economic (In May 2019 we will review the results after they takeover)
**Just sharing as study case and take your own risk to use it in your investment.
If you need the data, check below:
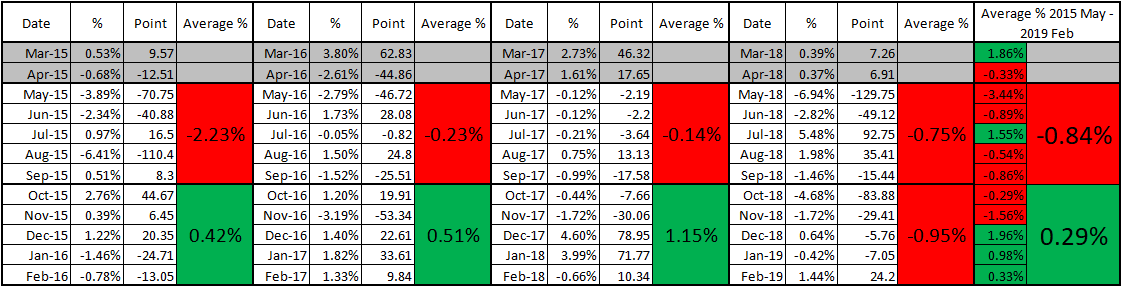
| Date | % | Point | Average % | Date | % | Point | Average % | Date | % | Point | Average % | Date | % | Point | Average % | Average % 2015 May - 2019 Feb | |
| Mar-15 | 0.53% | 9.57 | Mar-16 | 3.80% | 62.83 | Mar-17 | 2.73% | 46.32 | Mar-18 | 0.39% | 7.26 | 1.86% | |||||
| Apr-15 | -0.68% | -12.51 | Apr-16 | -2.61% | -44.86 | Apr-17 | 1.61% | 17.65 | Apr-18 | 0.37% | 6.91 | -0.33% | |||||
| May-15 | -3.89% | -70.75 | -2.23% | May-16 | -2.79% | -46.72 | -0.23% | May-17 | -0.12% | -2.19 | -0.14% | May-18 | -6.94% | -129.75 | -0.75% | -3.44% | -0.84% |
| Jun-15 | -2.34% | -40.88 | Jun-16 | 1.73% | 28.08 | Jun-17 | -0.12% | -2.2 | Jun-18 | -2.82% | -49.12 | -0.89% | |||||
| Jul-15 | 0.97% | 16.5 | Jul-16 | -0.05% | -0.82 | Jul-17 | -0.21% | -3.64 | Jul-18 | 5.48% | 92.75 | 1.55% | |||||
| Aug-15 | -6.41% | -110.4 | Aug-16 | 1.50% | 24.8 | Aug-17 | 0.75% | 13.13 | Aug-18 | 1.98% | 35.41 | -0.54% | |||||
| Sep-15 | 0.51% | 8.3 | Sep-16 | -1.52% | -25.51 | Sep-17 | -0.99% | -17.58 | Sep-18 | -1.46% | -15.44 | -0.86% | |||||
| Oct-15 | 2.76% | 44.67 | 0.42% | Oct-16 | 1.20% | 19.91 | 0.51% | Oct-17 | -0.44% | -7.66 | 1.15% | Oct-18 | -4.68% | -83.88 | -0.95% | -0.29% | 0.29% |
| Nov-15 | 0.39% | 6.45 | Nov-16 | -3.19% | -53.34 | Nov-17 | -1.72% | -30.06 | Nov-18 | -1.72% | -29.41 | -1.56% | |||||
| Dec-15 | 1.22% | 20.35 | Dec-16 | 1.40% | 22.61 | Dec-17 | 4.60% | 78.95 | Dec-18 | 0.64% | -5.76 | 1.96% | |||||
| Jan-16 | -1.46% | -24.71 | Jan-17 | 1.82% | 33.61 | Jan-18 | 3.99% | 71.77 | Jan-19 | -0.42% | -7.05 | 0.98% | |||||
| Feb-16 | -0.78% | -13.05 | Feb-17 | 1.33% | 9.84 | Feb-18 | -0.66% | 10.34 | Feb-19 | 1.44% | 24.2 | 0.33% | |||||
https://klse.i3investor.com/blogs/Backtesting/204217.jsp
