Steel Comebacks ? [ Technical Analysis ] – J4 Investment Capital
PRESTAR
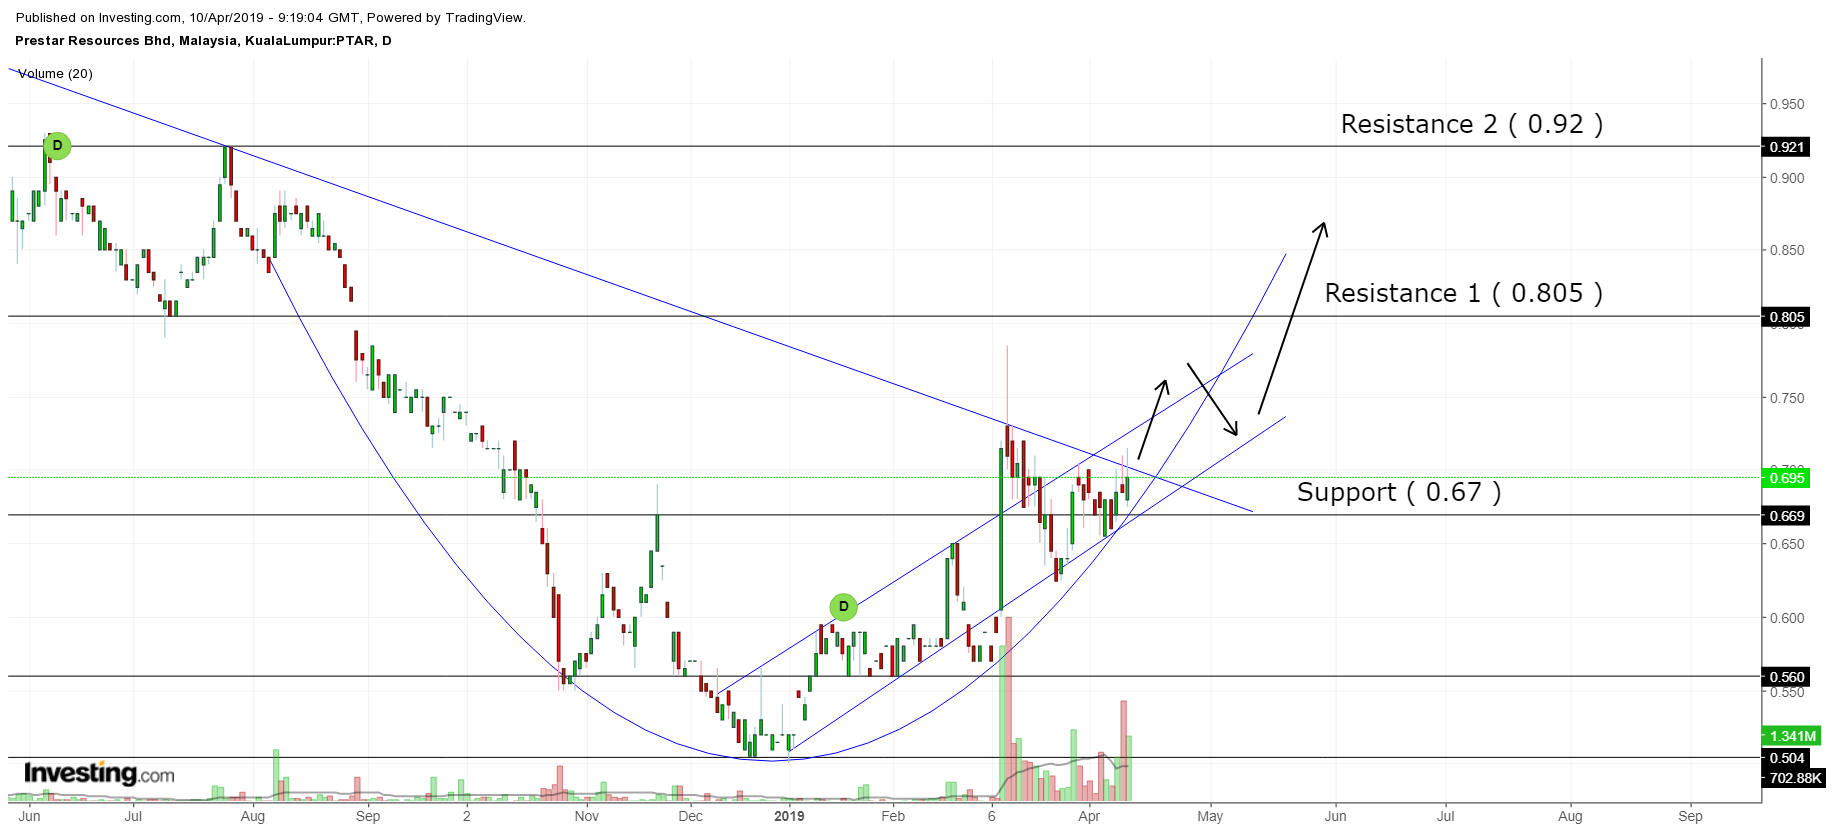
From the chart above , we can see that it is growing upwards and forming a cup and handle pattern at the end of it. There is also a short-term uptrend formed since Dec 2018 where the price rebounds. The price move along the trend in nice wave-like shape and forming a support line at RM 0.67 , which is a crucial line as it determines the next trend . We belived that a handle pattern is coming out and there should be a retracement once it reach RM 0.77 for a short break. However , the trend should be continuing as long as steel sectors is in a good sentiment. The resistance where it is placed at RM 0.805 will be its 1st Resistance and RM 0.92 will be the 2nd resistance. The following arrows are our prediction pathways which will be happening soon.
Photo Link : https://tvc-invdn-com.akamaized.net/data/tvc_10ca9a7705450c36a93d5c96ab113c4f.png?fbclid=IwAR26MA17tyAxwepK9tsuNYjpLAlglzk0Kmjn4q72LKxOFA0t6bU_Fn9aK4s
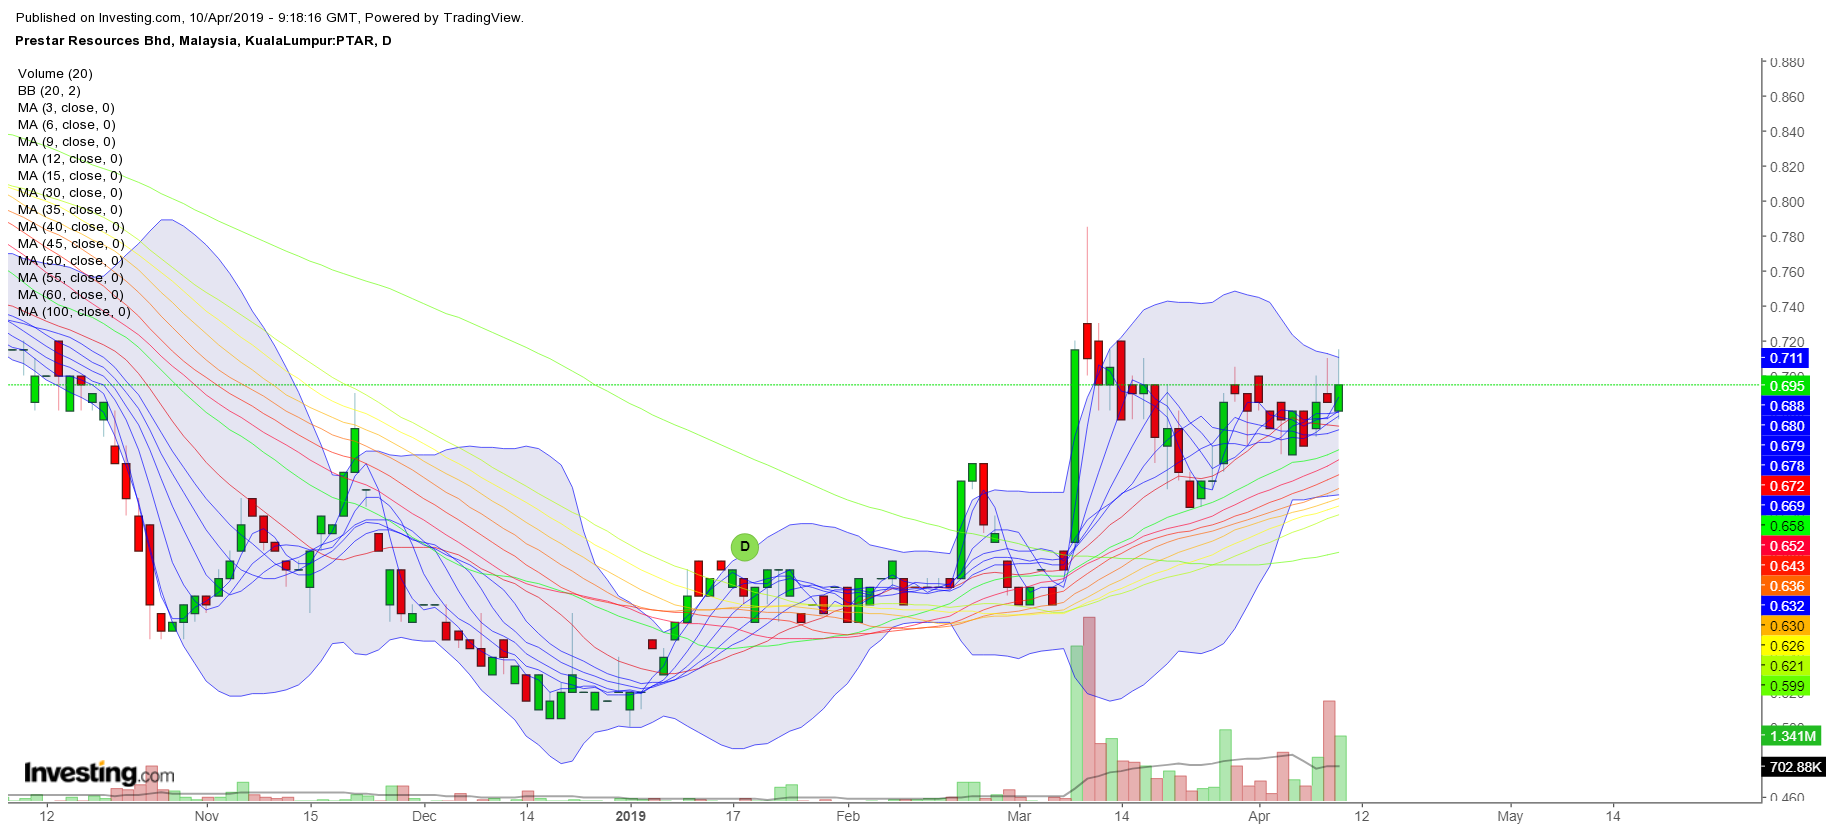
From the Moving Averages Chart above , we can see that the short term MAs has converge at the early of 2019 and crossing through the long term MAs. All the Moving Averages continue showing uptrend sign as they are all moving upwards. Based on the candlesticks , the price is supported by the MA 20 and MA 30 line. Therefore , those Moving Average will be its important line to relay on in this short term rally. The Bollinger bands also showing a uptrend sign as it is slowly forming a uptrend wave. Finally , the volume spikes since March as the market sentiment shows improvement. We believes that selling pressure is mostly from the retailer as the downward volume is starting to become lesser and lesser. Once the retracement is done , it will be a good time to go.
Photo Link : https://tvc-invdn-com.akamaized.net/data/tvc_1f6a75e66a2ec8cdb6f3874066b3058a.png?fbclid=IwAR2rQRqdezmEyC91ZnOnrIxLAS3QeAraBR_PQ5E0RpibWTpAIuGwyUURvHo
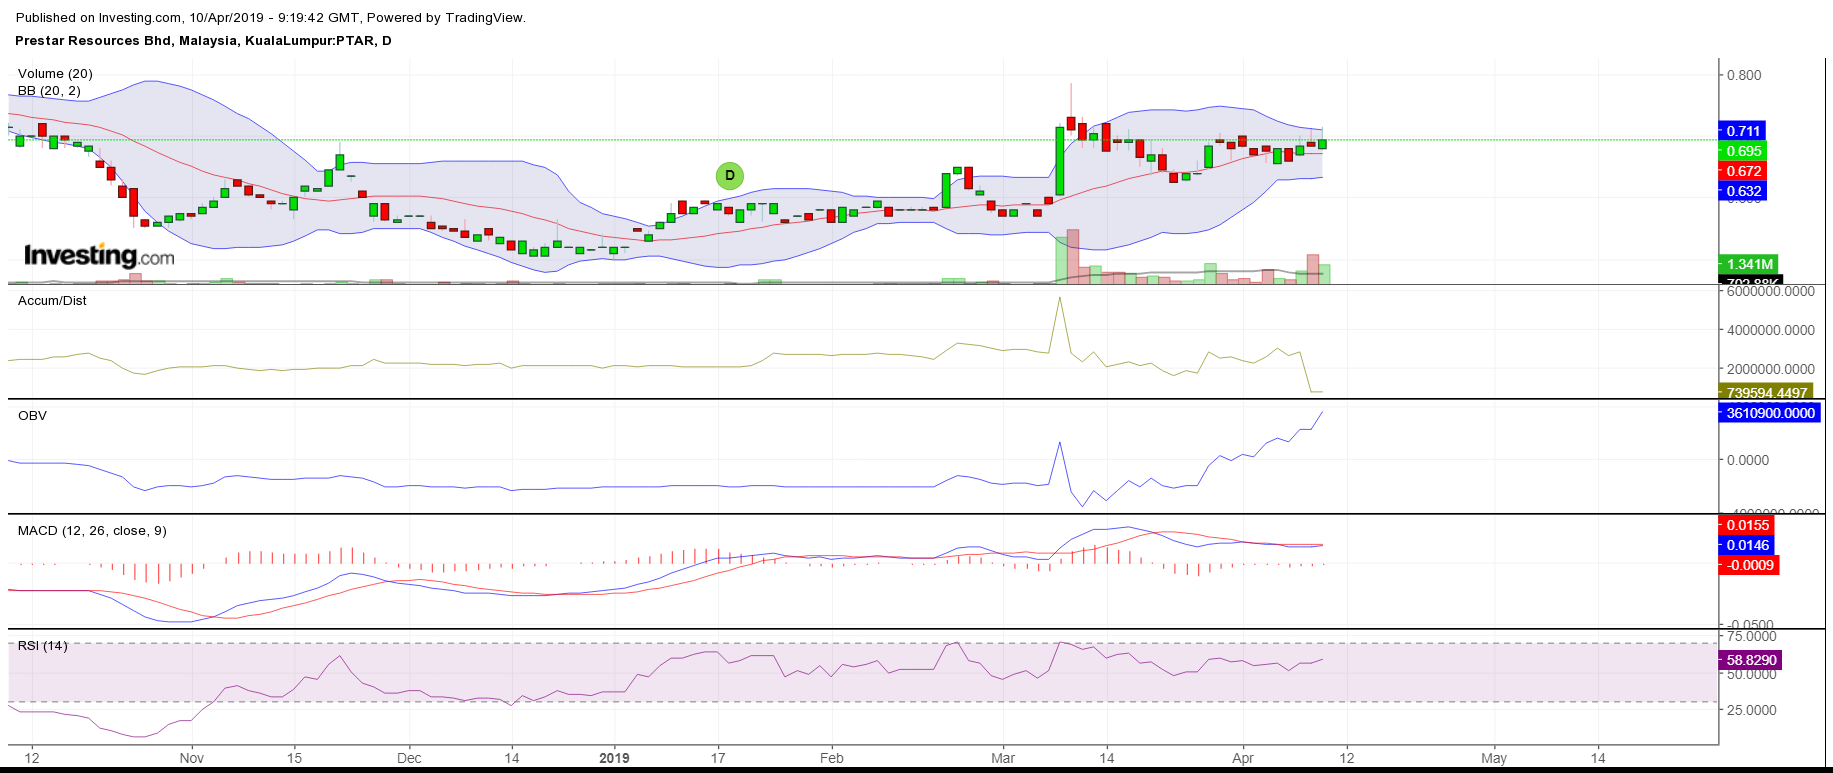
From the Technical Indicator Chart above , we can see that all the indicators are showing good sign . First is the Accum/Dist indicator , this indicator shows all the retailers movement . As I said , the retailers which are stuck at high price earlier are quiting at this price . However , on the OBV side , there is huge institution buying it non-stop . From this , we can conclude that , the main power is still on the spot. The MACD sign is still showing an average sign as it has not form a golden cross sign. Once the cross is formed , it will soon breaking new high. Lastly , the RSI sign is showing at 58 points . It is still not yet consider overbought . Therefore , with the supports from the indicators , we can say that this stock is safe to enter now.
Photo Link : https://tvc-invdn-com.akamaized.net/data/tvc_985743f4ea57f394eaadb9b19230d456.png?fbclid=IwAR0Nc9DbWSIGIhmTJw4kxeMqdbmB4FkhnuxOiQu-iYRm9pzdnKsW0cqF2oY
Entry Price : RM 0.595
Target Price : RM 0.80 / RM 0.91
Potential Percentage Gain : 25% / 51%
ANNJOO
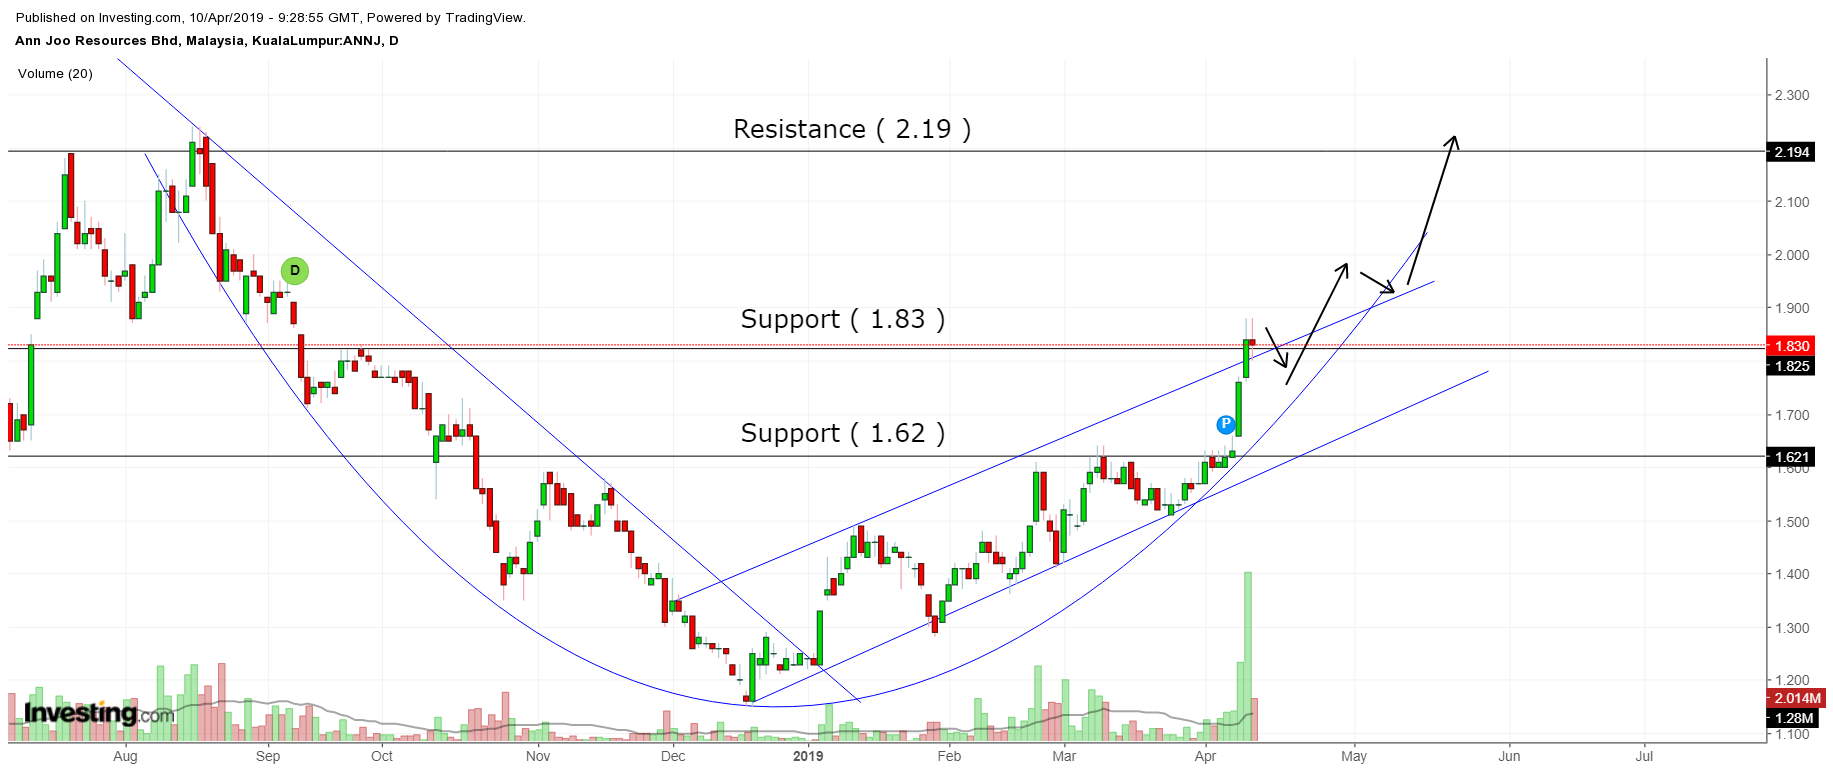
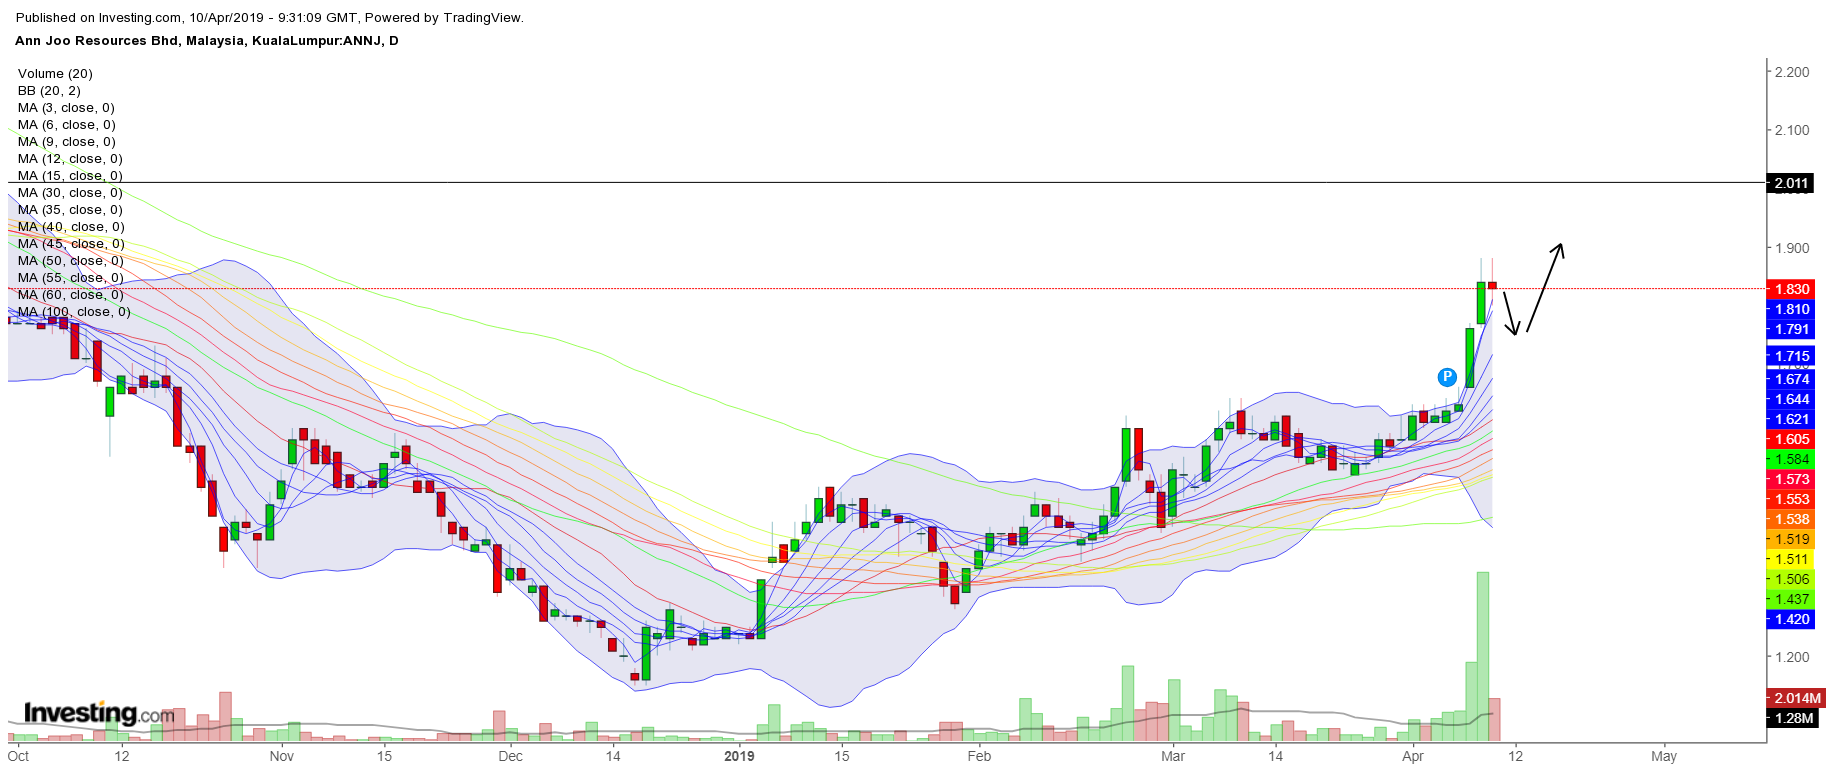
From the chart above , we can also see that there is a cup and handle pattern forming right now . This chart is almost same as PRESTAR as we can see the short-term uptrend tunnel has formed since it rebounds. However we predict that it will pause for a moment before the price continue surging as it has just from the RM 1.83 which is the resistance line previously. The next support line will be at RM 1.62 and the next resistance will be at RM 2.19 . We believe that the price will move side away in these trading days to recombine power for next rally.
Photo Link : https://tvc-invdn-com.akamaized.net/data/tvc_ed27ab0b2bd52e0c75fc40e1728e6d47.png?fbclid=IwAR2t4xHdgKlgEz6Mh42XY26YZwC6Ad9N8hrCTOt0m2QxK9Du_bX4REDuCls
From the Moving Average Chart above , we can see that it is very familiar with PRESTAR one too . It is also supported by the MA 20 and MA 30 . However , the long candlestick which is formed on few days ago has broke through every moving average and currently not supported by any of it . The huge volume has showed the exploding sentiment of this sector and showing a good sign of it. We predict the price is going to retrace or moving side-away soon to have a rest for coming days.
Photo Link : https://tvc-invdn-com.akamaized.net/data/tvc_5d2502f8a1bb970ec5a1d91ed2486e5f.png?fbclid=IwAR0PT_zMB2HM4xEO2olkLqHVwzH8djKFUybzYlAHUPOTKPEYSXzSUR6m9Jg
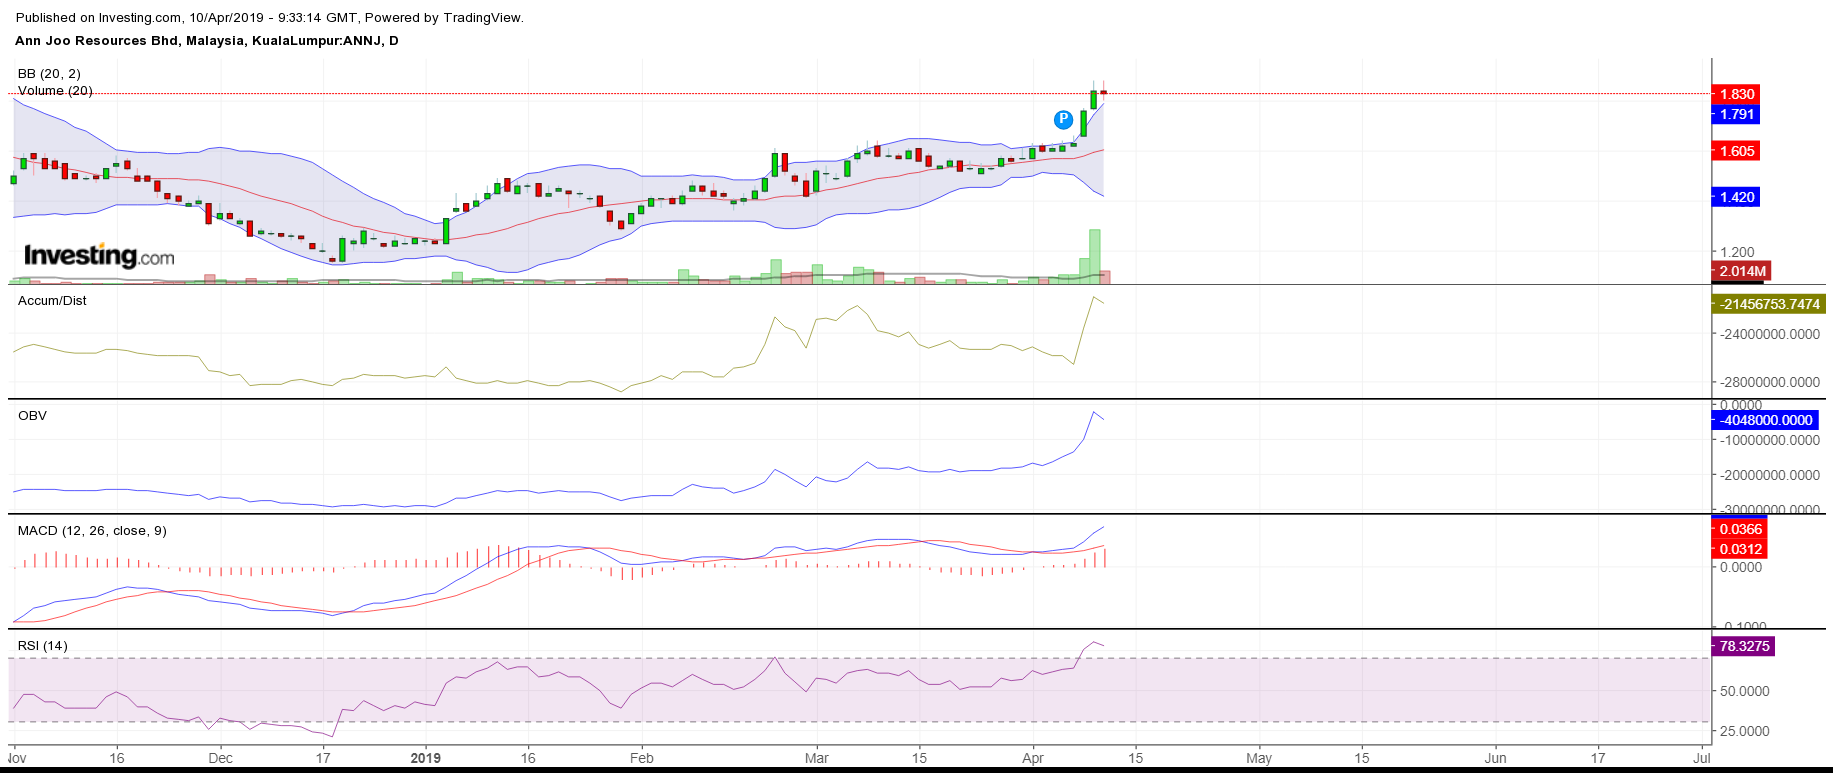
From the chart above , all of the indicators are also showing good sign . First of all is the Accum/Dist , it is showing uptrend sign and there is a huge spike together with the volume . Bothe the Accum/Dist and OBV shows the same sign , means all the traders and investors are rushing in at the same time . There is no sign of showing them throwing for now . On the MACD , the golden cross has formed and showing upward sign which is the blue line. However , the RSI has show an over-bought sign , which means it is tally with our prediction , that is to retrace and move side-away these days.
Photo Link : https://tvc-invdn-com.akamaized.net/data/tvc_2e04ef67c3eb28fc5aa8fb84c799b46d.png?fbclid=IwAR1HeYjSEBlvXw9yPg4qIe_hO149MS9RIvFYsqRtYej7upD-hBHFkcFfcmo
Entry Price : RM 1.65
Target Price : RM 2.19
Potential Percentage Gain : 32%
MASTEEL
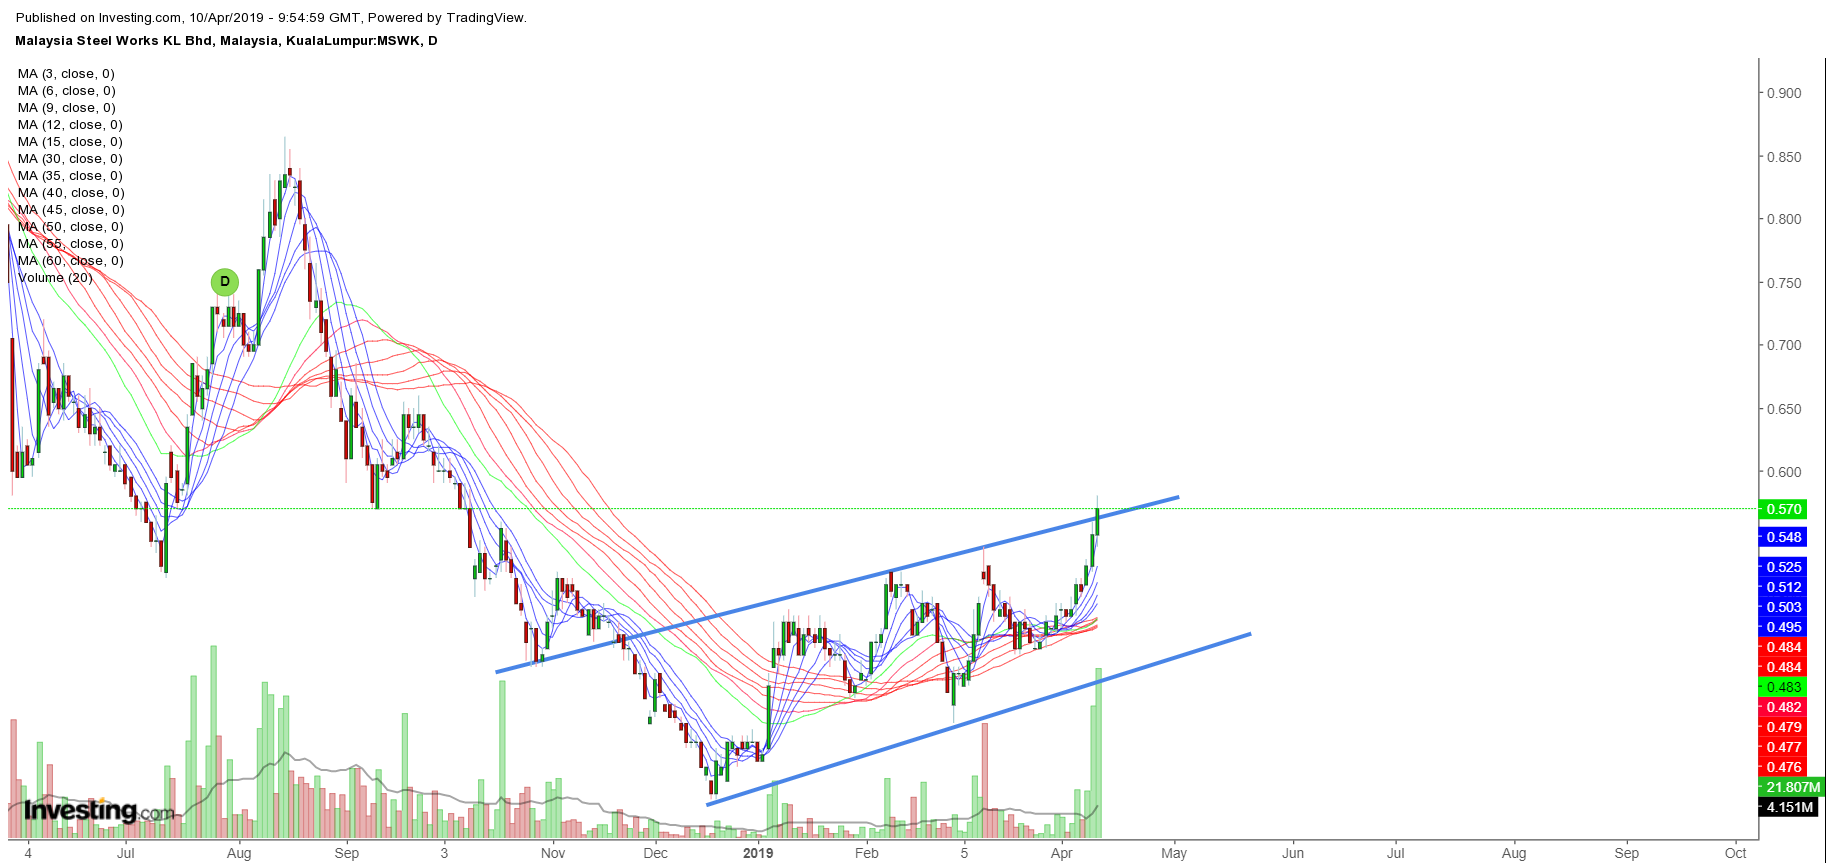
From the chart above , MASTEEL has breached its uptrend line, hence indicated a buy call at 0.47 . This breakout fulfil J4 Investment breakout criteria , which is trend line violating with high volume.Hence , we strongly see it as a breakout stock which will yield a minimum of 80 percent gain from 0.47 . Besides , as shown above , the moving average converge and slope upwards , and the price spike up above MA30 (green line) with high volume in the current days , it fulfils J4 Investment Capital secret indicator for a breakout stock .
Photo Link : https://tvc-invdn-com.akamaized.net/data/tvc_c087ee5601cf602f2473cc7abc5fdbfc.png?fbclid=IwAR24DyF1WNU4shKT5uBrlrRg6ndEXAg1E_5KNFMkHh9J7gZ85Rat_AqkjdQ
Entry Price : 0.47-0.475
Target Price: 0.865
TP2 and TP3 : stay tuned for more
LIONIND
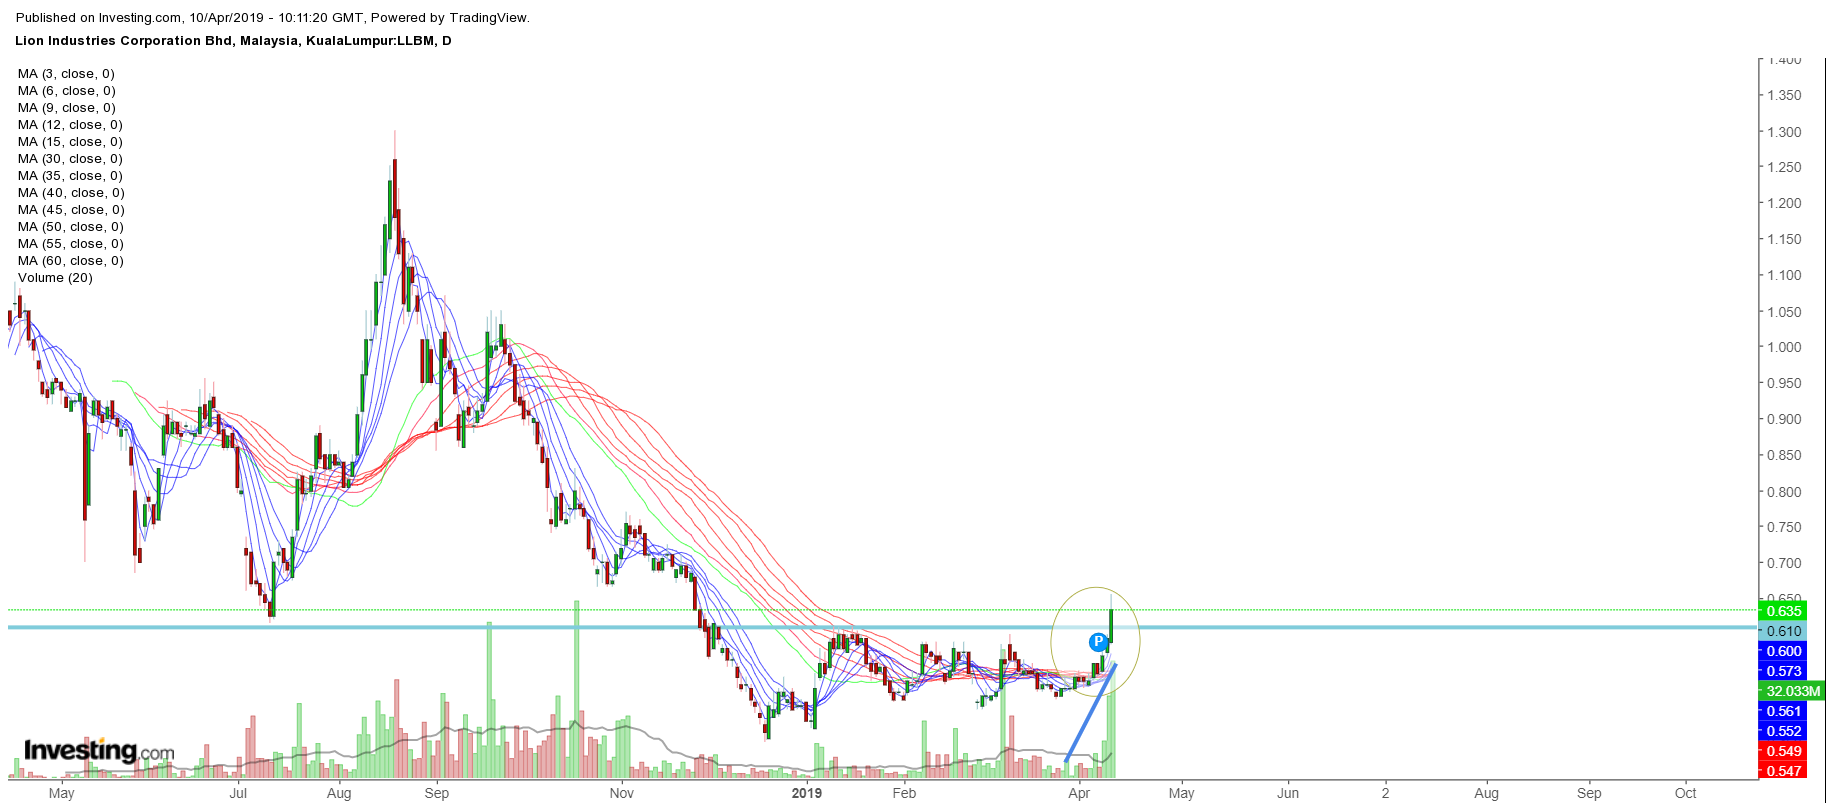
From the chart above , LIONIND fulfil J4 investment capital breakout criteria once again , the criteria are such as following
A) Resistance line being breached with high volume today , volume increase and a long green candle , its resistance at 0.61 turns support , fall below support CL
B) The price increase with high volume and stay above MA30 (green line) , indicates a strong upward moment is impending , it fulfils a bullish indicator of J4 investment capital
C) The spike in price completed a rectangle formation
Photo Link : https://tvc-invdn-com.akamaized.net/data/tvc_dcf1d4b6c17019fed3252bd3d194a853.png?fbclid=IwAR2RH1gmyCuGVh1qGYGHLMhVRn-k2QKfoiN3O46MXJgI3lJ3ZbvwKBQL5Qg
Entry Price : 0.615( best buy) , try to buy 10/4 opening price
Cut Loss : 0.61
Target Price : 0.89
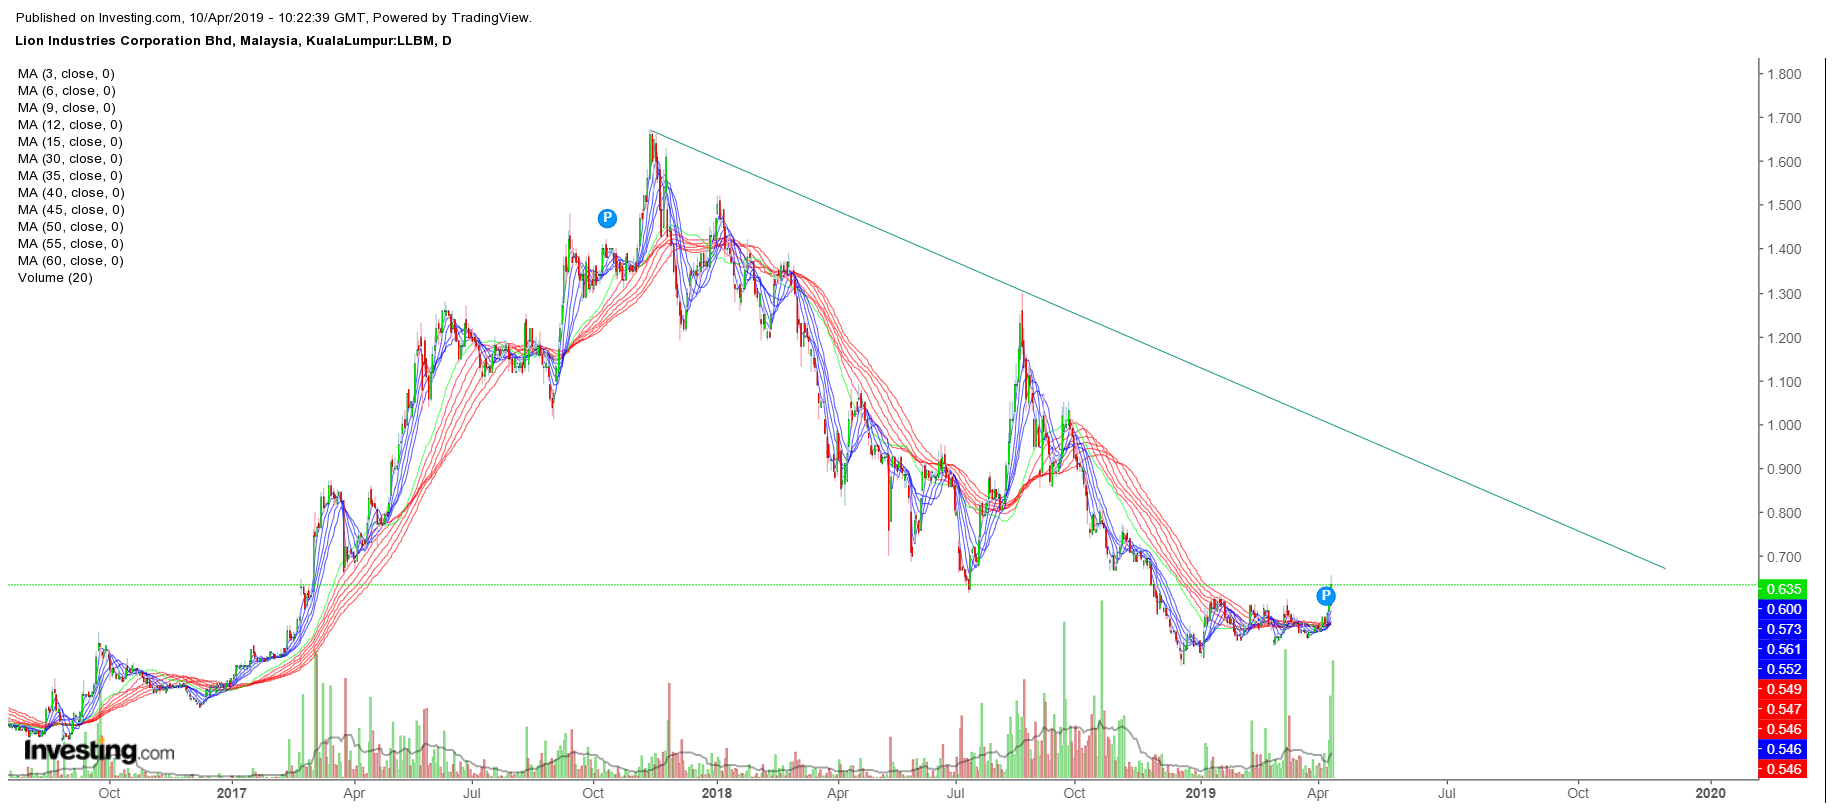
The target price is set by charting the downtrend of two previous peak , we expect a strong rebound towards the downtrend resistance line , it is now a change in trend , but not a trend reversal , a higher TP will be set if the downtrend line is breached with high volume .
Photo Link : https://tvc-invdn-com.akamaized.net/data/tvc_66e420c8ff002fc039f1702b845f6b9c.png?fbclid=IwAR03xDcCqG9LxOX-1yqAmrFo9D5PVlgfVwAUnnZEfLWk09ly2zICJQ4w_4M
Disclaimer : Information above is for sharing and education purposes , not a buy and sell advice , please refer to your advisory for any buy or sell call , buy and sell at your own risk .
注明 : 以上纯属分享 , 没有任何的买卖建议 , 请小心交易 .
Happy investing !
Feel free to visit our FB Page , gives us a LIKE and share it out so that we can share more things to you !!!
https://www.facebook.com/J4-Investment-Capital-398139627315097/
J4 Investment Capital.
https://klse.i3investor.com/blogs/j4investmentcapital/201834.jsp
