3 main market analysis:
1.) Technical Analysis
2.) Fundamental Analysis
3.) Sentiment Analysis
This time we study about Technical Analysis.
If you no familiar with "Technical Analysis" or TA.
Please read it >>> https://www.babypips.com/learn/forex/technical-analysis.
TA have many type of indicators it use in different situation or use by different formula.
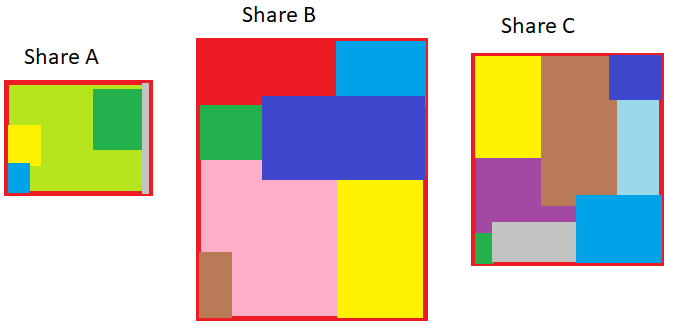
It because different share have different behavior. Reason as below can explain they human behavior are same but share share behavior not same,
We take example as below share A, B and C.
a.) Investor - Due to the way and reason they invest are different. So the price of share moving also different.
(you can consider different color, different colour if investor)
b.) Growth stock or Dividend stock or both.
c.) Seasonal stock - recurring patterns
d.) Profit and loss
e.) Business not same
Choose the correct TA indicator for the share u invest are important.
TA effect our buying and selling points.
Few way to choose suitable indicator:
1.) Follow Sifu, Teacher or friend advice from FB or I3.
2.) Base on own experience
3.) Just check the day chart with indicate and find the suitable indicator.
Example as below:
https://klse.i3investor.com/mqtrader/sf/chart/stk/5139

4.) Manual backtesting the record of buy sell from selected share and indication.
Compare to method 3, this method need check and records in excel file and to do the calculation. Than check the actual result.
5.) Using system to do checking. This method need higher level in system and programing.
It can be ROBOT, auto backtest or manual bestest with excel.
Example backtest as below:
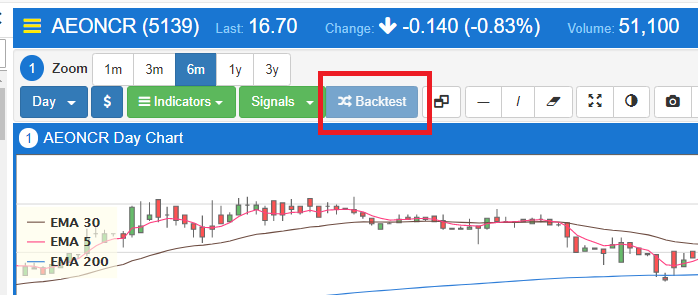
Normally I check the chart with favorite indicator than use backtesting with excel to check the previous results with that indicator.
Example (for study propose not buy call) as below:
1.) Base on fundamemtal analysis and sentiment analysis, I choose AEONCR.
2.) Agar-agar check the with EMA5 and EMA30 clossing and found it suitable
Chart link : https://klse.i3investor.com/mqtrader/sf/chart/stk/5139
About EMA: https://www.babypips.com/learn/forex/exponential-moving-average
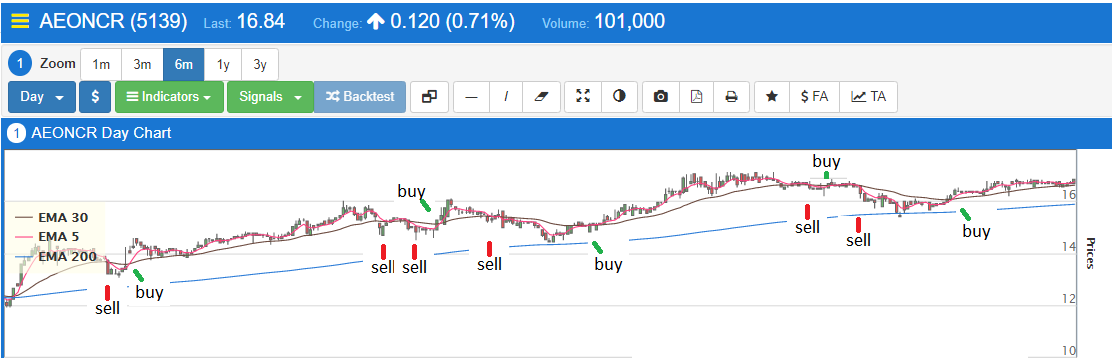
3.) Backtest checking actual gain loss by use daily data and excel with EMA formula. (can check few favorite indicator and select the best to use)
Data link:https://www.investing.com/equities/aeon-credit-service-(m)-bhd-historical-data
a) Data I taken 20/Sep/2011 until today (Totals 1895 trading day)
b) 1st buying point 8/Nov/2019 with RM4.12
c) Totals buying point = 36 with totals profit RM17.7 and 1 buying point not yet take profit (better than from RM4.12 to RM16.7)
* it not include divident
Currently EMA indocator suitable AEONCR.
d) before buy, forecast selling point and reason to TP. Study profit and loss ratio.
e) After bough just time to time follow up, if got indicator to TP or cutloss just follow it
Take note example only no buy call =.=.....
Remember
It maybe change due to some popular sensei or sifu or coach come introdue or goreng those share.
The indicator maybe change due to many reason. So not all in and too believe you indicator.
1.) Technical Analysis
2.) Fundamental Analysis
3.) Sentiment Analysis
This time we study about Technical Analysis.
If you no familiar with "Technical Analysis" or TA.
Please read it >>> https://www.babypips.com/learn/forex/technical-analysis.
TA have many type of indicators it use in different situation or use by different formula.
It because different share have different behavior. Reason as below can explain they human behavior are same but share share behavior not same,
We take example as below share A, B and C.
a.) Investor - Due to the way and reason they invest are different. So the price of share moving also different.
(you can consider different color, different colour if investor)
b.) Growth stock or Dividend stock or both.
c.) Seasonal stock - recurring patterns
d.) Profit and loss
e.) Business not same
Choose the correct TA indicator for the share u invest are important.
TA effect our buying and selling points.
Few way to choose suitable indicator:
1.) Follow Sifu, Teacher or friend advice from FB or I3.
2.) Base on own experience
3.) Just check the day chart with indicate and find the suitable indicator.
Example as below:
https://klse.i3investor.com/mqtrader/sf/chart/stk/5139
4.) Manual backtesting the record of buy sell from selected share and indication.
Compare to method 3, this method need check and records in excel file and to do the calculation. Than check the actual result.
5.) Using system to do checking. This method need higher level in system and programing.
It can be ROBOT, auto backtest or manual bestest with excel.
Example backtest as below:
Normally I check the chart with favorite indicator than use backtesting with excel to check the previous results with that indicator.
Example (for study propose not buy call) as below:
1.) Base on fundamemtal analysis and sentiment analysis, I choose AEONCR.
2.) Agar-agar check the with EMA5 and EMA30 clossing and found it suitable
Chart link : https://klse.i3investor.com/mqtrader/sf/chart/stk/5139
About EMA: https://www.babypips.com/learn/forex/exponential-moving-average
3.) Backtest checking actual gain loss by use daily data and excel with EMA formula. (can check few favorite indicator and select the best to use)
Data link:https://www.investing.com/equities/aeon-credit-service-(m)-bhd-historical-data
a) Data I taken 20/Sep/2011 until today (Totals 1895 trading day)
b) 1st buying point 8/Nov/2019 with RM4.12
c) Totals buying point = 36 with totals profit RM17.7 and 1 buying point not yet take profit (better than from RM4.12 to RM16.7)
* it not include divident
Currently EMA indocator suitable AEONCR.
d) before buy, forecast selling point and reason to TP. Study profit and loss ratio.
e) After bough just time to time follow up, if got indicator to TP or cutloss just follow it
Take note example only no buy call =.=.....
Remember
It maybe change due to some popular sensei or sifu or coach come introdue or goreng those share.
The indicator maybe change due to many reason. So not all in and too believe you indicator.
https://klse.i3investor.com/blogs/WahLau/216066.jsp
