TASHIN (0211) TASHIN HOLDINGS BERHAD - The Misunderstood Steel Player
The misunderstood steel player
Company Background
Tashin Steel is the wholly-owned and principal operating subsidiary of Tashin Holdings Bhd. Tashin commenced operations in October 1999. The principal business activities of Tashin are (i) the processing of steel coils into slit coils and sheet (ii) the manufacturing of steel products (steel pipes, C Purlins and expanded metals) and (iii) trading of steel products (steel pipes, steel plates, round beers , angle bars and wire mesh. The group has a diversified base of domestic clients from various industries (engineering, E&E, manufacturers). 99% of Tashin’s revenues are from the domestic market. (see Figure #1)
Incorporated in 1998 as a shelf company, in September 1999, Tashin Steel was acquired by Prestar by one of the promoters with the intention of setting up a steel processing plant in Northern Peninsular Malaysia. Subsequently, Prestar approached Lim Choon Teik together with other investors to acquire Formula Naga, shelf company to enter into a joint venture with Tashin and Prestar.
On 8 August 2000, Tashin acquired an existing factory in Penang with a land area of 218k sq ft which consists of factory and office block. This marks the commencement of its operation in the processing of slit coils and steel sheets as well as manufacturing of flat bars, square bars and expanded metals.
Figure #1Organization structure after the acquisition of Tashin Steel and IPO
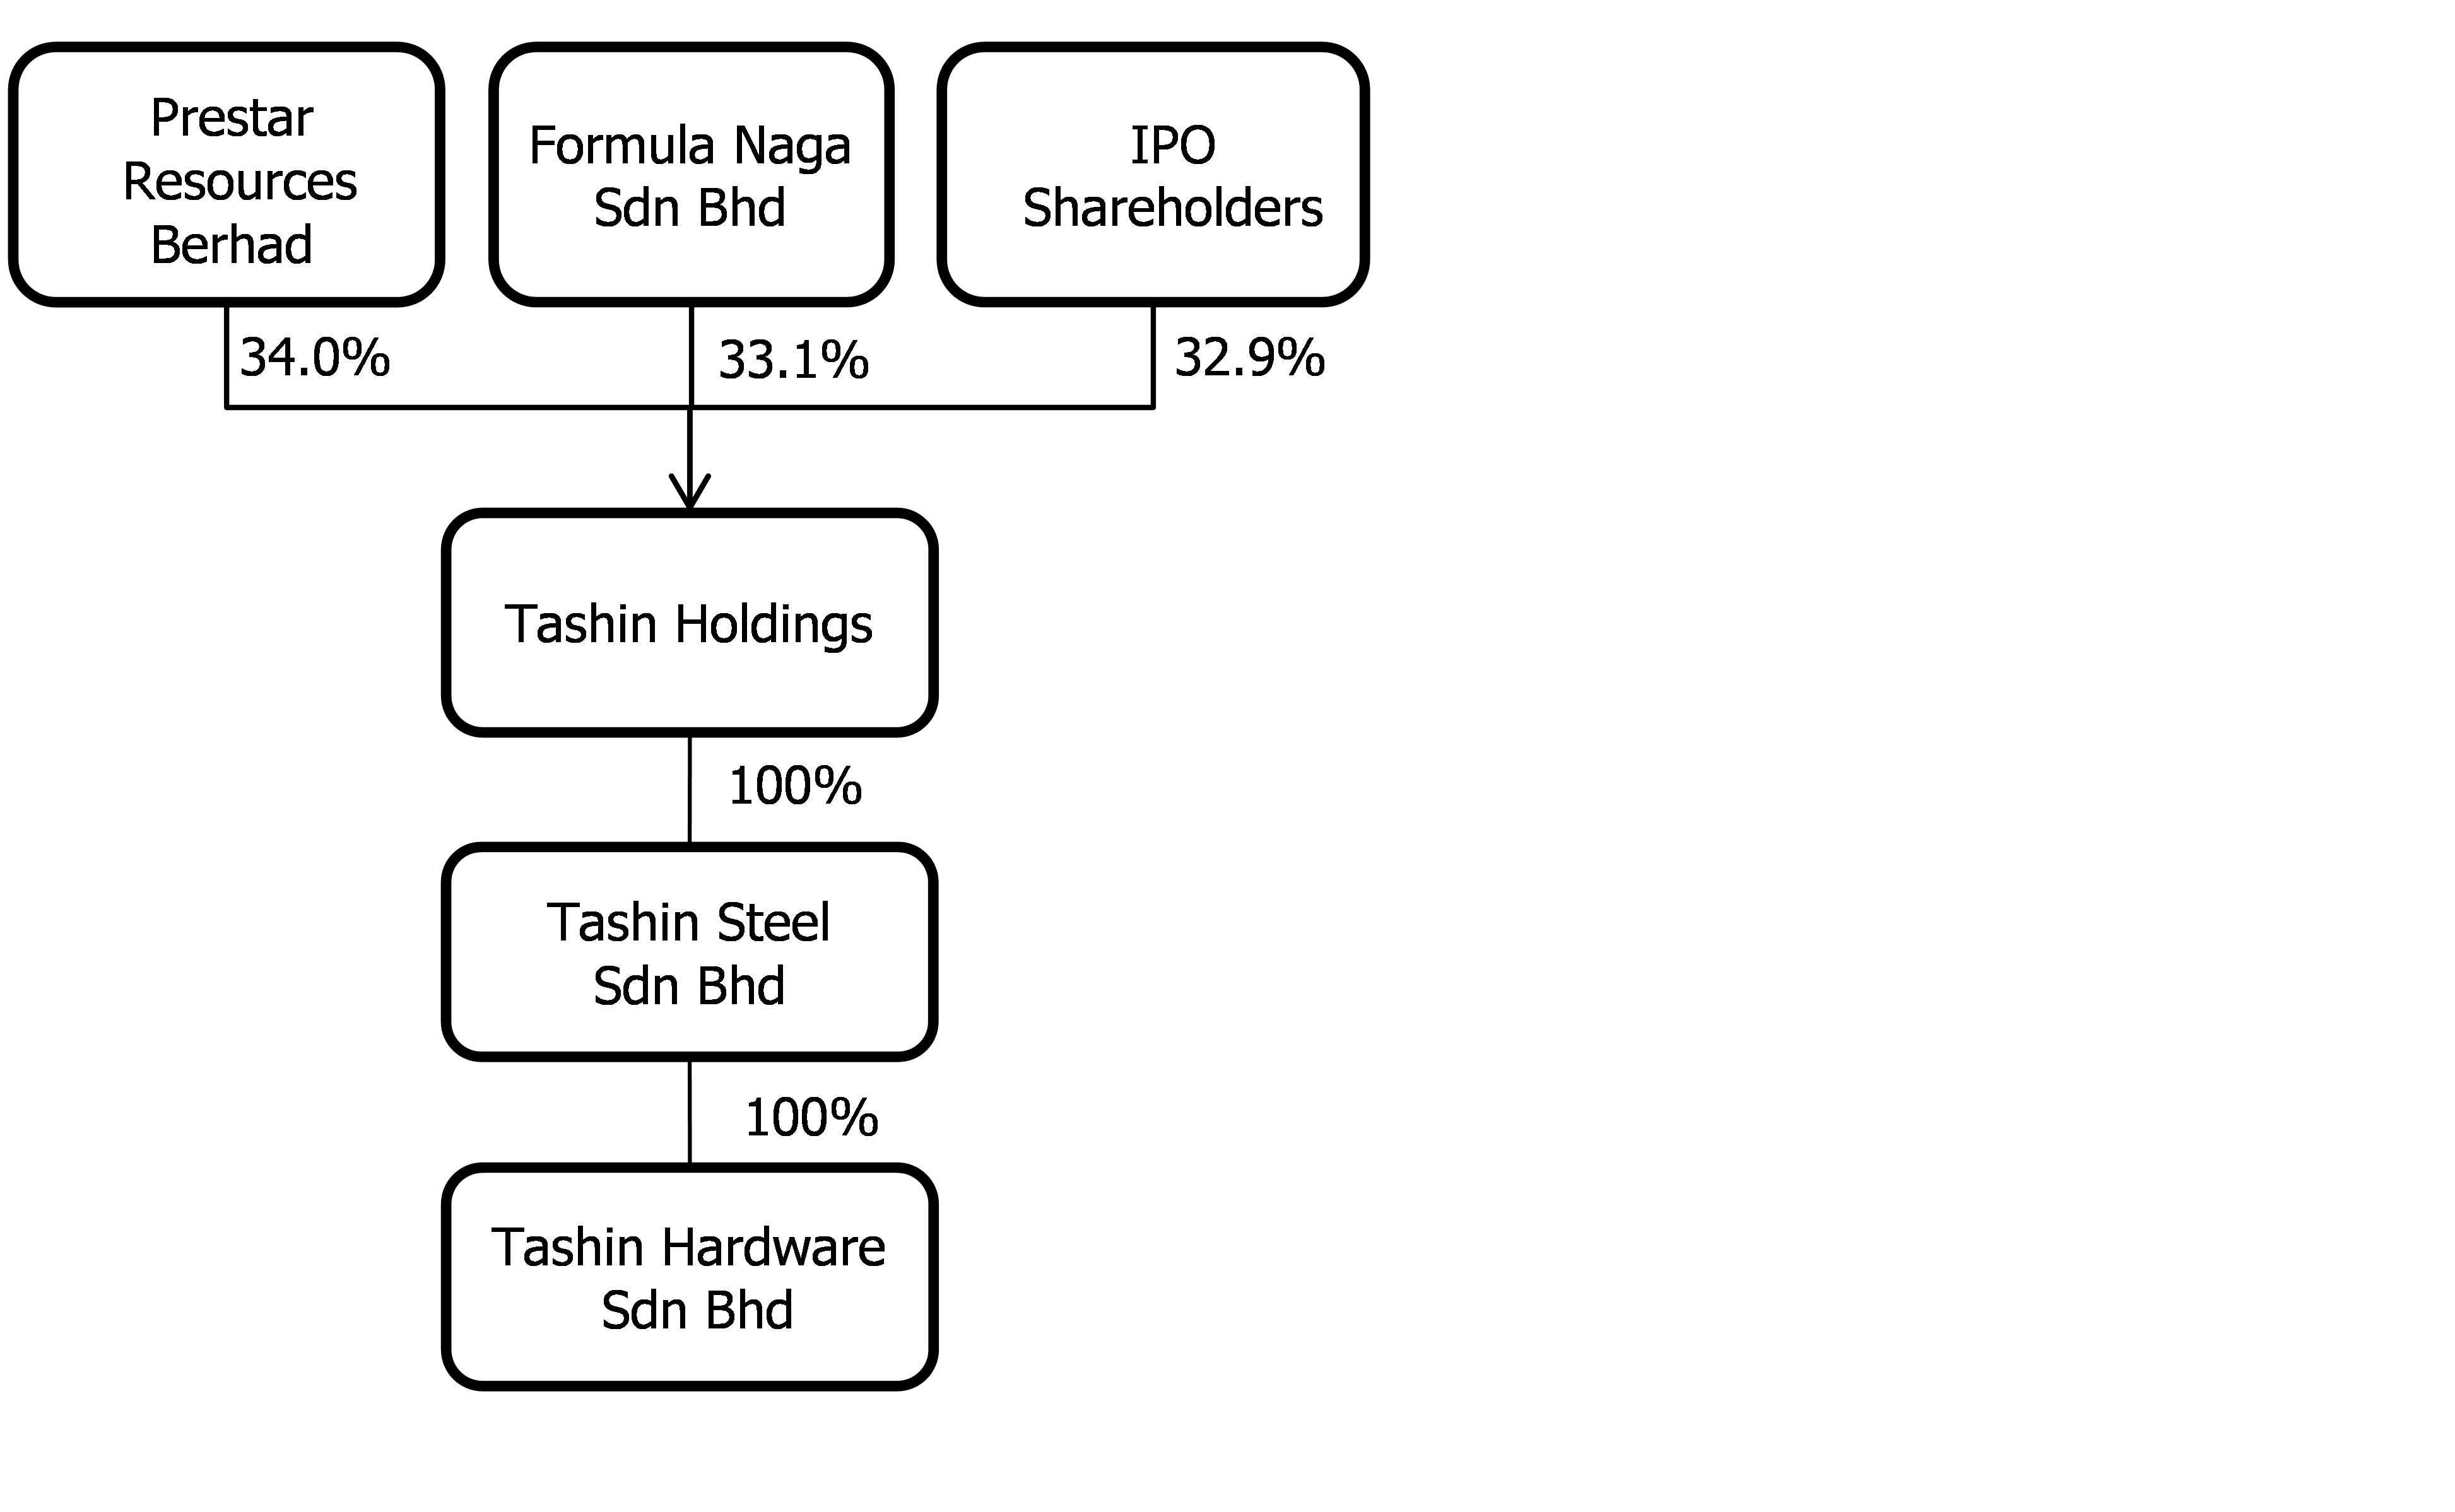 |
Figure #2Profile of key management personnel and board
|
Position |
Name
|
Years in Tashin
|
|
Independent Non-Executive Chairperson |
Dato’ Kalsom Binti Abd Rahman
|
2
|
|
Managing Director |
Lim Choon Teik
Foong Kok Chuin
|
2
|
|
Executive Director/Chief Financial Officer |
Sim Pei Chuan
|
2
|
|
Senior Independent Non-Executive Director |
Khaw Chooi Kee
|
2
|
|
Independent Non-Executive Director |
Rusdy Bin Ishak
|
2
|
|
Independent Non-Executive Director |
Ir. Tan Tiong Ben
|
2
|
|
Independent Non-Executive Director |
Dato, Toh Yew Peng
|
2
|
|
Independent Non-Executive Director |
Tow Yew Seng
|
2
|
|
Independent Non-Executive Director |
Koay Kah Ee
|
2
|
Figure #3List of customer
|
Industry |
Types of steel
|
Relationship with Tashin
|
FY16 revenue
|
FY17 revenue
|
FY18 revenue
|
|||
|
RM m
|
%
|
RM m
|
%
|
RM m
|
%
|
|||
|
Steel stockist |
Standard and customised
|
20
|
104.0
|
48.4
|
124.4
|
48.3
|
130.4
|
50
|
|
Automotive |
Customised
|
12
|
38.8
|
18.1
|
43.4
|
16.8
|
44.9
|
17.2
|
|
Manufacturing |
Standard and customised
|
18
|
38.2
|
17.8
|
49.1
|
19.0
|
43.0
|
16.5
|
|
Engineering |
Standard and customised
|
3
|
20.1
|
9.4
|
22.8
|
8.9
|
22.6
|
8.7
|
|
Construction |
Standard and customised
|
18
|
9.2
|
4.3
|
10.9
|
4.2
|
12.5
|
4.8
|
|
Steel centre and steel manufacturer |
Standard and customised
|
10
|
2.1
|
1
|
2.7
|
1.0
|
1.2
|
0.5
|
|
Others |
Standard and customised
|
Various
|
2.3
|
1
|
4.5
|
1.8
|
6.0
|
2.3
|
|
Total revenue
|
214.7
|
100
|
257.7
|
100
|
260.5
|
10
|
||
Figure #4Capacity installation & utilisation rates
|
2017 |
Capacity (MT)
|
Actual production (MT)
|
Utilization rate (%)
|
|
Steel Processing |
115,440
|
80,876
|
70%
|
|
Steel Manufacturing |
34,080
|
19,206
|
56%
|
Thesis
Midstream - downstream steel player
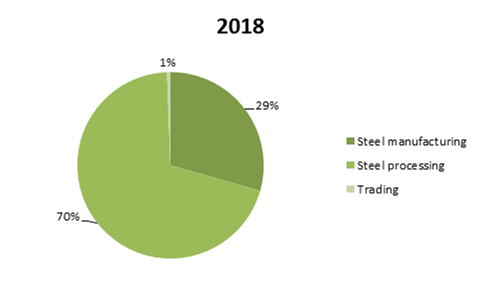
Steel sector is divided into 3 main categories namely, upstream, midstream and downstream. Based on Tashin principal business activities, Tashin is operating in the midstream and downstream portion of the steel sector. As a midstream company, Tashin is involved in the processing and manufacturing of steels products while for the downstream, the business activity is mainly trading. Typically, midstream and downstream steel companies differ significantly from upstream steel companies (e.g. CSC, Mycron and Hiap Teck). Midstream companies source their key materials (steel coils) from the upstream players e.g. CSC, Mycron or imports directly from overseas (China). Because of this, Tashin is partially shielded from various risks and concern faced by upstream steel players such as (1) the fluctuations in iron ore prices and (2) dumping of steel coil by overseas steel mills e.g. China & Vietnam (3) competition from foreign-owned mill (4) overcapacity issue
Figure #5Revenue Segmentation
Wide range of products
Tashin processing and manufacturing facilities located in Seberang Prai are able to offer a range of steel products to various end user industries such as manufacturing, automotive, engineering and steel fabrication, construction as well as to steel centres and steel product manufacturers. Tashin steel facilities consistently produced on average 100 MT – 109MT of steel annually equivalent to 67% to 74% effective utilisation rate for processing and 56% to 73% for manufacturing lines.
Long term relationship with customers and suppliers
Tashin’s steel has a respectable position in the industry of more than 18 years (refer to figure #3). The long-term relationship has allowed Tashin to secure stable and recurring order from customers and suppliers. Based on the relationship, Tashin is able to maintain uninterrupted raw materials from suppliers and thus, deliver the order for its products timely to its clients.
Resilient demand outlook
The demand for steel processing in Malaysia is hovering around 4.8m MT/pa to 5m MT/pa since 2014 with the automotive sector anchoring the demand around 598k MT to 666k MT per annum. According to Smith Zander, the demand for steel processing in Malaysia based on the consumption of cold rolled steel sheets and strips, hot rolled steel sheets and strips is set to grow from 4.89m MT/pa in 2017 to 5.1m MT/pa in 2020 at CAGR of 1.4%, mainly to support the usage of steel in manufacturing activities. In addition, the recent 25% import tariff on steel products from Vietnam will have muted impact to steel industry in Malaysia. Steel players will be able to pass the additional cost to customers and sell their products at prevailing steel prices.
Not overly exposed to the upstream issues
Based on Tashin business model, any fluctuations in raw material costs will be transferred to its customers due to the customization of product. Furthermore, sales are based on order basis, they do not engage in long term sales contracts. Furthermore, Tashin does not face any issues dealing with dumping of steel coil by China, in fact it is the opposite, Tashin is a beneficiary of the steel coil dumping in China as it has decreased their raw material costs. Tashin imports around 30% of its raw materials.
A proxy to the Proton turnaround play
According to the Malaysia Automotive Association (MAA) forecasted total TIV at 600k unit for 2019, of which Proton (Tashin’s client) has 18% market share the highest in 47 months. Based on the latest sales figure, Proton recorded 18.3k units of vehicle, surging 92% QoQ and 27.3% YoY. Management of Proton alluded that vehicle sales are expected to reach 25k units, fuelled by the X70 models. Riding on this, we believe Tashin will be in a strong position to record a bump up in orders from Proton given Proton’s plan to launch various model in FY20 and FY21 line-ups, including new X70 CKD and Saga facelift by end-2019 and X50 in mid-2020.
Figure #6Proton X70 – a real steal

Risks
Raw materials are the largest component in the cost of sales, consistently constituting more than 90% of total cost of sales. The price of Tashin’s raw materials is subject to the fluctuations of global steel prices.
Figure #7COS By Currency
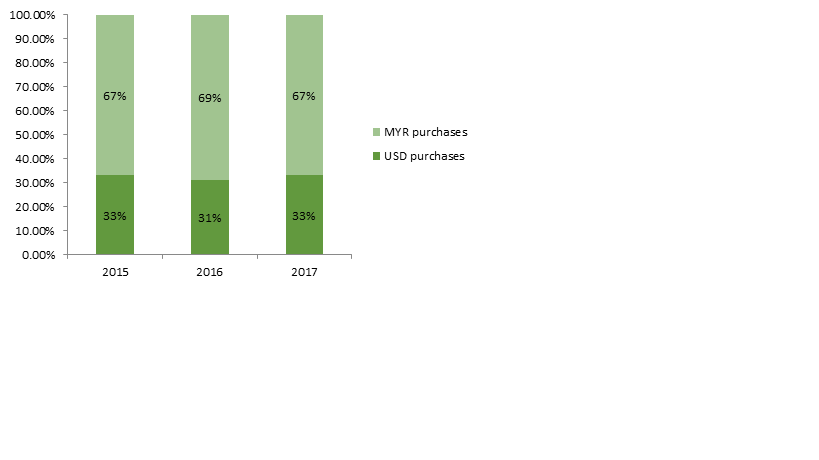 A
substantial amount of raw materials are denominated in USD (c.31%-33%).
The volatility of the ringgit vs. the greenback could significantly
affect the group’s margins.
A
substantial amount of raw materials are denominated in USD (c.31%-33%).
The volatility of the ringgit vs. the greenback could significantly
affect the group’s margins.
IPO details
Based on the IPO price of RM0.58, the total gross proceeds of approximately RM34.4m from the public issue will be mainly utilised for capacity expansion and working capital (see Figure #6). The IPO entails a public issue of 59,329,000 new ordinary shares, and an offer for sale of 55,489,000 shares at an IPO price of RM0.58/share. Public issue: 17,449,600 new shares for application by the Malaysian public; 8,724,800 new shares for application by eligible parties; 17,449,600 new shares for entitled shareholders of Prestar Resources Bhd; and 15,705,000 new shares by way of private placement to identified Bumiputera investors approved by MITI.
Figure #8Use of IPO proceeds
|
Details |
RM m
|
%
|
Estimated time frame
|
|
|
|
|
|
|
Land acquisition and construction of new factory: |
|
|
|
|
- Land acquisition |
7.20
|
20.92
|
9 month
|
|
- Construction of new factory |
10.35
|
30.08
|
24 month
|
|
Purchase of machinery and equipment for: |
|
|
|
|
- 5 wire mesh manufacturing lines |
4.10
|
11.91
|
20 month
|
|
-1 slitting line |
1.80
|
5.23
|
6 month
|
|
- 5 packing machines |
1.80
|
5.23
|
6 month
|
|
General working capital |
5.96
|
17.32
|
12 month
|
|
Estimated listing expenses |
3.20
|
9.3
|
1 month
|
|
|
|
|
|
|
Total |
34.41
|
100
|
|
Financials
Tashin posted respectable revenue growth in the last 4 years. Despite lower sales volume in both steel processing and steel manufacturing, Tashin posted higher revenue growth in the both segments. Notably, benefiting from escalating global steel prices, FY17 revenue surged 20% YoY as both processing and manufacturing recorded better revenue by 21.8% YoY and 12.2% YoY respectively. Trading segment revenue was doubled in FY17 due to higher trading volume as well as increase in ASP.
In FY18, Tashin revenue grew marginally by 1.1% as slower steel processing revenue by 4.0% was cushioned by contribution from steel manufacturing which recorded higher revenue of RM15.5m (25.4%). Steel processing segment was weighed by slower volume by its major customer namely Dai Dong Steel Sdn Bhd, which is a wholly-owned subsidiary of Prestar. On the other hand, steel manufacturing revenue of RM76.6m (25.4%) benefited from escalating global steel prices and higher volume for both long products.
In FY17 revenue surged 20% YoY, aided by both steel processing and steel manufacturing segments. Steel processing segment grew 21.8% YoY in FY17 fuelled by higher ASP of RM3,168/MT (23.5% YoY), in line with escalating global steel coil prices amid lower sales volume. Meanwhile, steel manufacturing posted a 12.2% YoY growth to RM61.1m
Tashin earnings grew at CAGR of 55% from FY15 to FY17 benefited from higher global steel prices amid stable raw materials trends. During this period, Tashin’s GP margin was stable at ~13%, mainly from the reason stated, which pushed the overall results. Nevertheless, earnings decelerated to RM11.8m (-28%) as GP margin dropped as higher global steel prices was more than offset by the increase in raw materials prices.
Valuation
At IPO price of RM0.58/share, Tashin is priced at a trailing PER of 17.96x FY18 core EPS. We found that, the offer price is fairly attractive given Tashin business in the both midstream and downstream. Further analysis implies that, in the wake of higher raw materials price, Tashin is able to pass the additional cost to its long serving customers, and hence reducing the risk of diminishing margin. Therefore Tashin premium valuations is akin to the valuations accorded to Dialog (a midstream-downstream o&g player) vs. say a pure upstream play such as Velesto or Sapura. Ascribing a PER of 15x will result in a price target of RM0.59 which we believe is fair given that the dynamics for Tashin is different, Tashin is able to (1) pass on thru the cost of raw materials much like the glove players, (2) it is a direct beneficiary of the Proton turn around play and lastly (3) it is a rare horse amongst steel players in that it is still profitable.
DISCLAIMER!!!
This report is NOT a buy/sell/hold recommendation as per the ones released by licensed brokers and IB’s. This report is based on my own assumptions and is for knowledge sharing purposes only. It is a work of fiction. Please do your own research before deciding to risk your capital. Live long and prosper. Peace. I am in no way responsible for anything that happens to you if you decide to follow this work of fiction.
Financials
|
|
FY2015
|
FY2016
|
FY2017
|
FY2018
|
FY2019f
|
FY2020f
|
|
Revenue |
212.28
|
214.74
|
257.70
|
260.55
|
273.57
|
287.25
|
|
Cost of sales |
-196.42
|
-185.25
|
-221.57
|
-235.39
|
-244.80
|
-254.59
|
|
Gross profit |
15.87
|
29.49
|
36.13
|
25.16
|
28.77
|
32.66
|
|
Other income |
1.00
|
0.96
|
2.20
|
5.42
|
5.64
|
5.86
|
|
Selling and distribution expenses |
-2.44
|
-2.61
|
-3.42
|
-2.85
|
-2.96
|
-3.08
|
|
Administrative expenses |
-6.36
|
-6.86
|
-9.10
|
-9.10
|
-9.47
|
-9.85
|
|
Other operating expenses |
-0.32
|
-4.15
|
-2.08
|
-1.10
|
-1.15
|
-1.19
|
|
Finance cost |
-2.84
|
-2.35
|
-2.24
|
-2.89
|
-3.00
|
-3.12
|
|
Interest income |
0.09
|
0.11
|
0.17
|
0.19
|
0.20
|
0.21
|
|
PBT |
4.99
|
14.59
|
21.67
|
14.83
|
18.03
|
21.48
|
|
Taxation |
-0.83
|
-2.40
|
-5.96
|
-3.55
|
-4.33
|
-5.16
|
|
PAT |
4.16
|
12.18
|
15.72
|
11.28
|
13.70
|
16.33
|
|
Revaluation surplus |
0.00
|
0.00
|
21.39
|
0.00
|
0.00
|
0.00
|
|
Core earnings |
4.16
|
12.18
|
37.11
|
11.28
|
13.70
|
16.33
|
|
|
|
|
|
|
|
|
|
EBIT |
7.74
|
16.83
|
23.74
|
17.53
|
28.53
|
34.48
|
|
EBITDA |
10.32
|
19.49
|
26.94
|
21.20
|
32.53
|
38.48
|
|
GP margin |
7.47
|
13.73
|
14.02
|
9.66
|
10.52
|
11.37
|
|
PBT margin |
2.35
|
6.79
|
8.41
|
5.69
|
6.59
|
7.48
|
|
PAT margin |
1.96
|
5.67
|
6.1
|
4.33
|
5.01
|
5.68
|
|
Tax rate |
16.58
|
16.46
|
27.48
|
23.93
|
24.00
|
24.00
|
|
EPS |
1.44
|
4.21
|
5.43
|
3.89
|
4.73
|
5.64
|
|
Diluted EPS |
1.19
|
3.49
|
4.5
|
3.23
|
3.93
|
4.68
|
Appendix
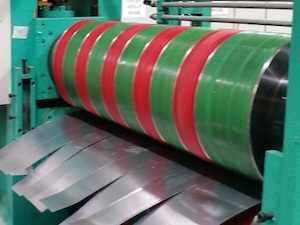
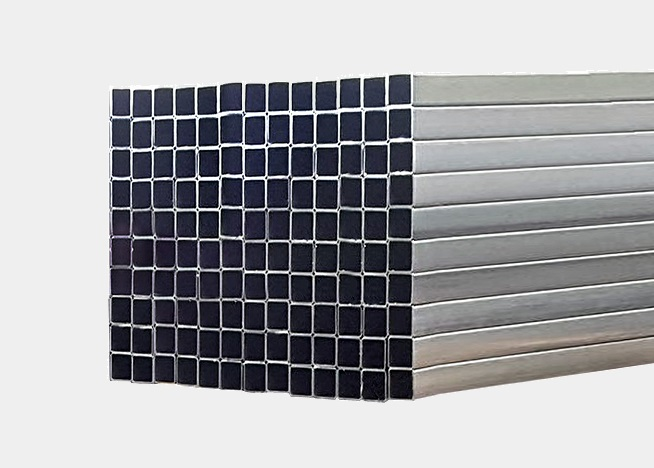
Slit coils
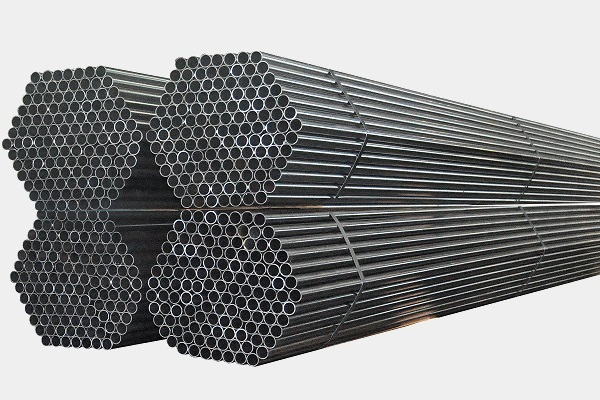
Steel Pipes
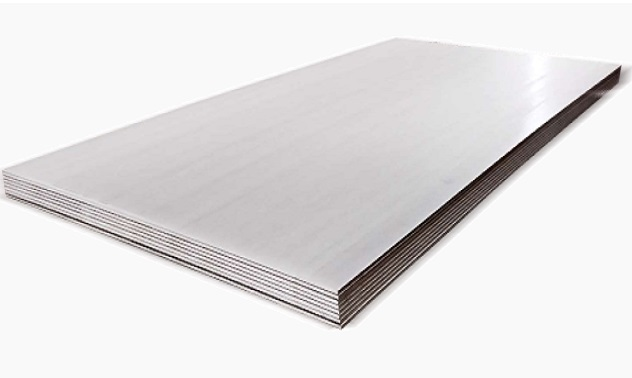
Steel Plates & Sheets
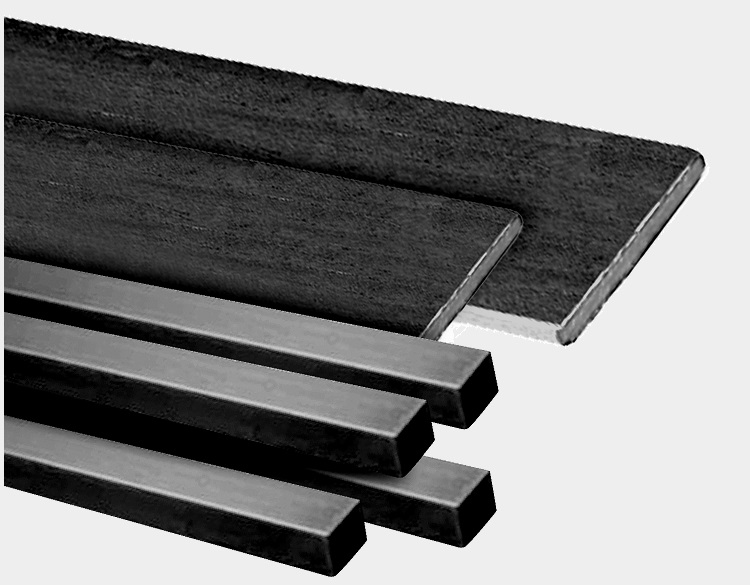
Flat square bars
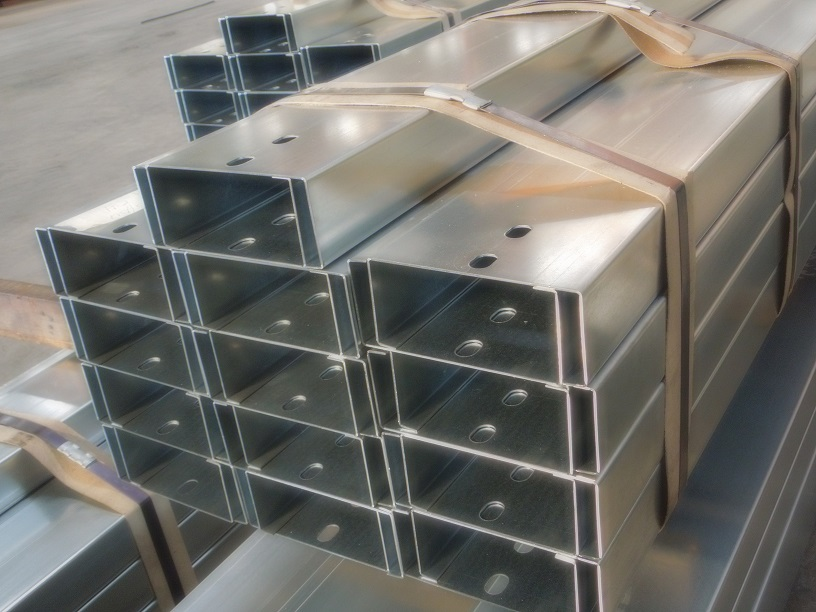
C Purlins
https://klse.i3investor.com/blogs/knowledgesharing/217514.jsp
