Weekly Time Frame
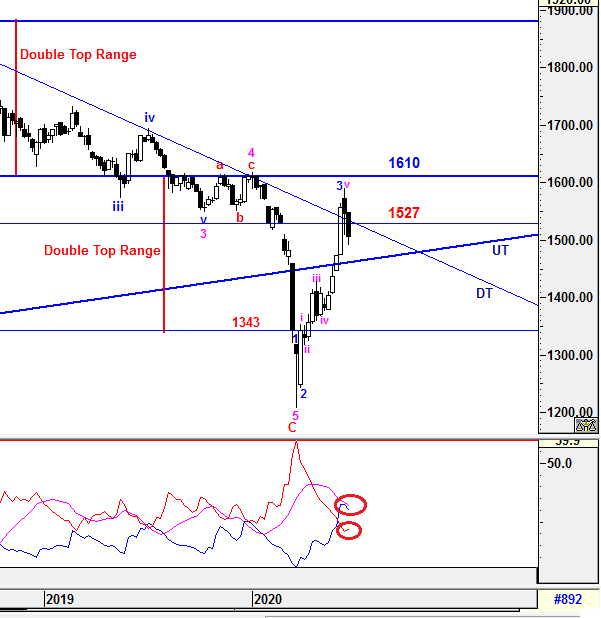
The selling pressure had continued after broken down below DT line and critical support at 1527 which indicated trend reversal is prominent with a false breakout above DT line last 2 weeks ago. However, UT line again is become the critical level to watch.
As expected, ABC correction waves is underway which will be elaborated further in daily time frame.
-DMI (red line) curved up & +DMI (blue line) curved down indicates bullish momentum is decreasing with decreasing in volatility which
implied from ADX (pink line) as it is still heading down. As mentioned,
It would hover around before a new trend to be taken placed.
Prevailing trend could be emerged if levels listed below was broken:
Resistance - 1528
Support - 1483
Critical Support - 1465 (UT line)
Daily Time Frame
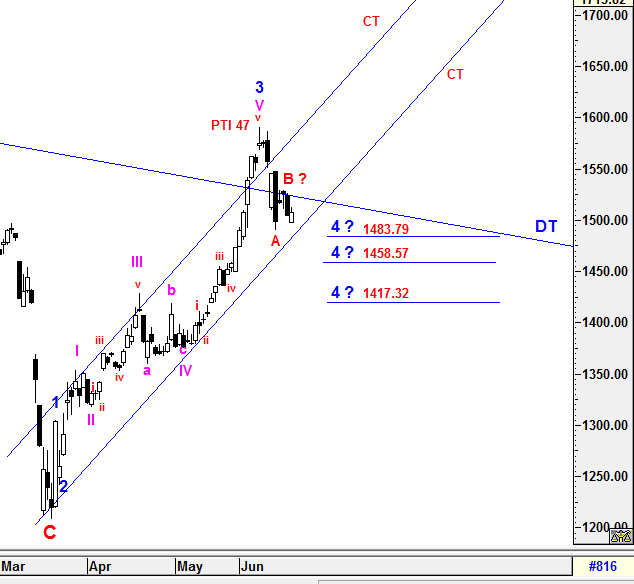
To recap, the higher degree of 4th wave (4) correction's projected Fibo levels of 1483.79, 1458.57 and 1417.32 are still valid. Currently, Wave A could be formed and ended at 1490.44. Therefore, Wave B had started.
From the wave count validity rules, Wave B has just met the minimum criteria to qualtify 38.2% Fibo retracement target at 1528.63. However, i will not rule out that more possible levels which might be constructed and underway as listed below:
1) If KLCI is able to break above 1528.63, then Wave B will be ended towards higher level in between 1552 - 1590 which populated based on wave counts' criteria.
2) If KLCI break below 1490.44 (Wave A), then Wave B will be ended at 1528.63 and Wave C may take place from here towards lower level.
To reiterate, the higher degree of 4th wave (4) correction will be completed when Wave C end if there is no complex wave X formation along the waves construction. Besides that, the current PTI reading (47) is still showing positive indication that the current magnitude correcton is healthy enough to succeed the next higher degree of 5th wave (5) after higher degree of 4th wave (4) end.
Last but not least, the entire
correction waves would still be monitored closely to anticipate any
complex wave form structure being emerged within the CT line currently.
Prevailing trend could be emerged if levels listed below was broken:
resistance - 1528
support - 1500
All waves' count and projected target
are generated based on past/current price level and it may be subjected
to vary if degree of momentum movement has changed.
Trade safely
Wave Believer
https://klse.i3investor.com/blogs/E_Wave/2020-06-21-story-h1508905184-KLCI_waves_12.jsp
