A share price chart is a record of the daily closing price of a stock over a period of time. It can help investors to make good investment decision.
The Covid 19 pandemic is affecting all the listed companies with the exception of medical gloves and medical products that can prevent contacting the coronavirus. As a result, the demand for gloves far exceeds supply and all the glove makers can increase their selling price easily to make more and more profit which are being reflected on their share prices. All the glove makers do not have the same margin of profit. Moreover, the share price movements of all the glove makers do not move up at the same rate.
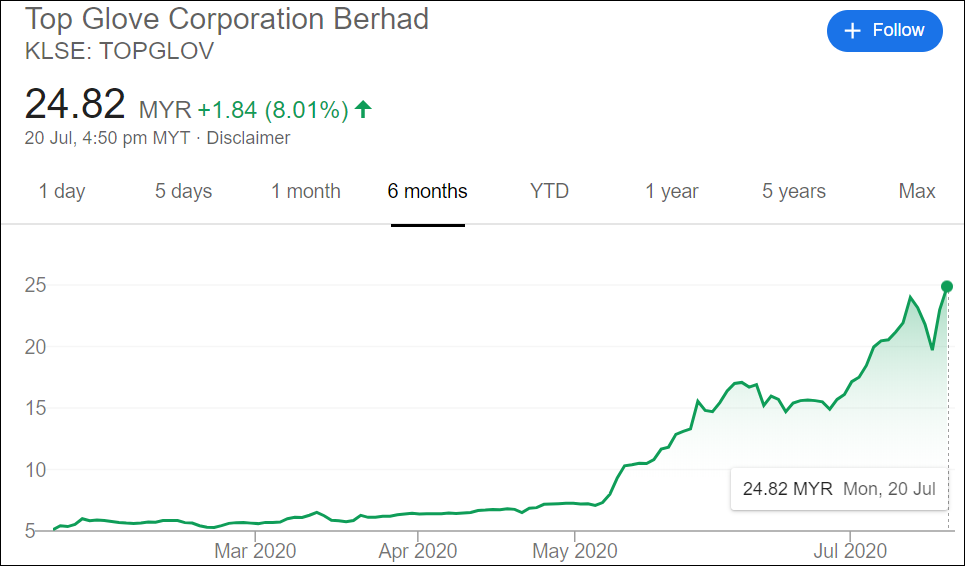
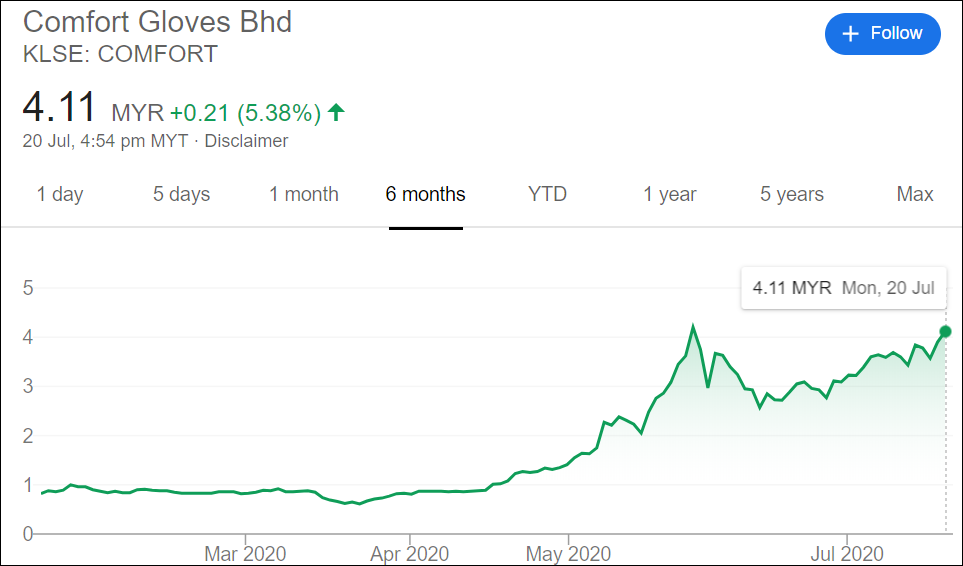
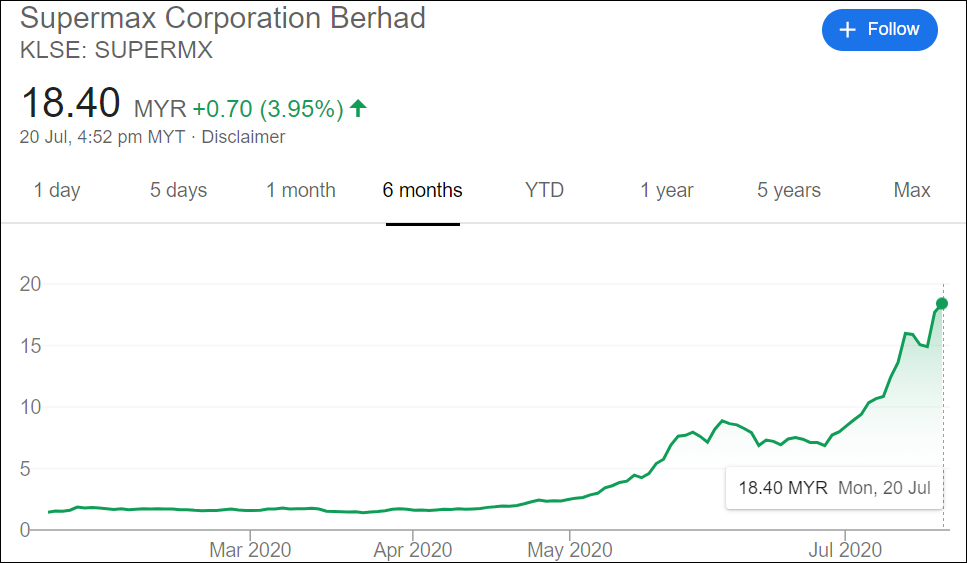
In view of all these complications, the price charts can help investors to make good investment decision. The 3 charts below show the price movement of Comfort, Top Glove and Supermax in the last 6 months.
Comfort shot up from 90 sen to close at Rm 4.11, an increase of 457%.
Top Glove shot up from Rm 6.50 to close at Rm 24.80, an increase of 382%
Supermax shot up from Rm 2.00 to close at Rm 18.40, an increase of 920%.
Based of the above comparison, investors should sell Supermax to buy Top glove and Comfort. I prefer to buy Top Glove because it is more than double the size of Supermax in terms of manufacturing capacity and a world leader in this glove business.
https://klse.i3investor.com/blogs/koonyewyinblog/2020-07-20-story-h1510636002-Price_chart_can_help_investors_Koon_Yew_Yin.jsp
