Basic Profile
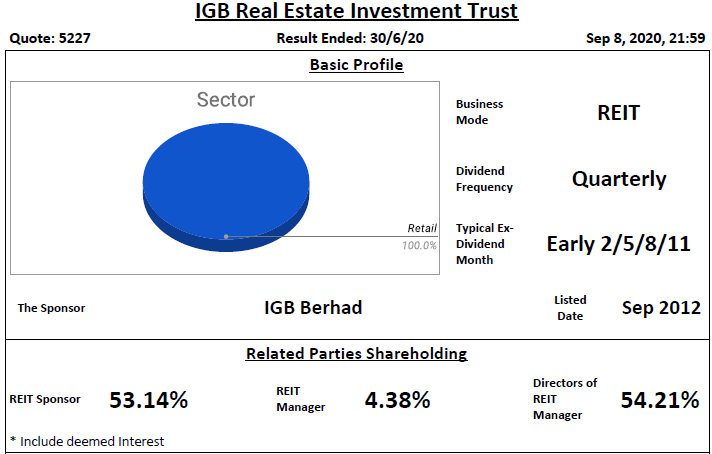
IGB REIT (IGB) is a retail REIT that owns 2 properties in Kuala Lumpur.
One is Mid-Valley Megamall and the other is The Gardens Mall.
Key Statistics

With market cap at RM 6.5 Billions, IGB is the second largest REIT in
Malaysia after KLCC Property Holdings Berhad, which is a stapled group.
Lease Profile

Occupancy is high at 99%. WALE (estimated) is slightly short at 1.61
years where the highest least expiry of 39.2% is in this year, as per
the latest annual report. Weighted average land lease expiry is slightly
short at 83 years.
Debt Profile

Gearing ratio is low at 23.4%. Cost of debt is moderate at 4.4%. All of
IGB debts are fixed and secured. Interest cover ratio is high at 5.6
times. WADE is long at 4.2 years where the highest debt maturity of
98.8% falls in the year 2022.
Diversification Profile

Top geographical and top property contributions are high at 100% and
70.1%. Top tenant contribution is low at 9.5%. Top 10 tenants
contribution by NLA is moderate at 49%.
Key Financial Metrics

Property yield, distribution on capital and distribution margin are
high at 6.5%, 5% and 54.2% respectively. Management fee is competitive
in which unitholders receive $7.90 distribution for every dollar paid.
Trend

If we look at pre-COVID time, DPU is quite stable from 2017 to 2019.
NAV per unit maintains throughout the 5 years. Interest cover ratio is
improved since the issuance of medium term notes in 3Q 2017. Due to the
usage of medium term note to repay term loan in 3Q 2017, therefore
interest cover surges in that quarter. Property yield is improving since
2016 but start dropping in 2020 due to COVID. Distribution margin
started to drop slightly since 2018.
Relative Valuation

i) Average Dividend Yield - Average yield at 5.15 %, apply the past 4 quarters DPU of 7.06 cents will get RM 1.37.
ii) Average Price/NAV - Average value is at 1.53, apply the latest NAV of S$ 1.073 will get RM 1.64.
Author's Opinion
| Favorable | Less Favorable |
|---|---|
| Occupancy | WALE |
| Gearing Ratio | Concentrated Debt Maturity |
| Interest Cover Ratio | Top Geographical Contribution |
| WADE | Top Property Contribution |
| Top Tenant Contribution | |
| Property Yield | |
| Management Fee | |
| Distribution on Capital | |
| Distribution Margin |
The recent performance has been greatly impacted due to COVID and MCO.
In the current RMCO period, the retail crowd has seen returning which
should help in improving IGB performance in the coming quarters.
For more information, you could refer:
SREITs Dashboard - Detailed information on individual Singapore REIT as well as summary
SREITs Data - Overview of Singapore REIT
REIT Analysis - List of previous REIT analysis posts
REIT Investing Community - Facebook Group where members share and discuss REIT topic
*Disclaimer: Materials in this blog are based on my research and
opinion which I don't guarantee the accuracy, completeness, and
reliability. It should not be taken as financial advice or statement of
fact. I shall not be held liable for errors, omissions as well as loss
or damage as a result of the use of the material in this blog. Under no
circumstances does the information presented on this blog represent a
buy, sell, or hold recommendation on any security, please always do your
own due diligence before any decision is made.
https://klse.i3investor.com/blogs/reittirement/2020-09-09-story-h1513403719-IGB_REIT_Analysis_9_September_2020.jsp
