Wednesday Nov 27th, Vivocom Stock Code 0069
Cl Price 96.5c Vol 100.3M
Walao Eh, INI KALI LAH Vivocom
Sunshine & Rainbow Showtime - TP RM1.52 Don’t play play! Betul dan TEPAT punya Kali Ini.
- A triangle chart pattern involves price moving into a tighter and tighter range as time goes by and provides a visual display of a battle between bulls and bears.
- A triangle pattern is generally considered to be forming when it includes at least five touches of support and resistance.
- For example, three touches of the support line and two for the resistance line. Or vice versa.
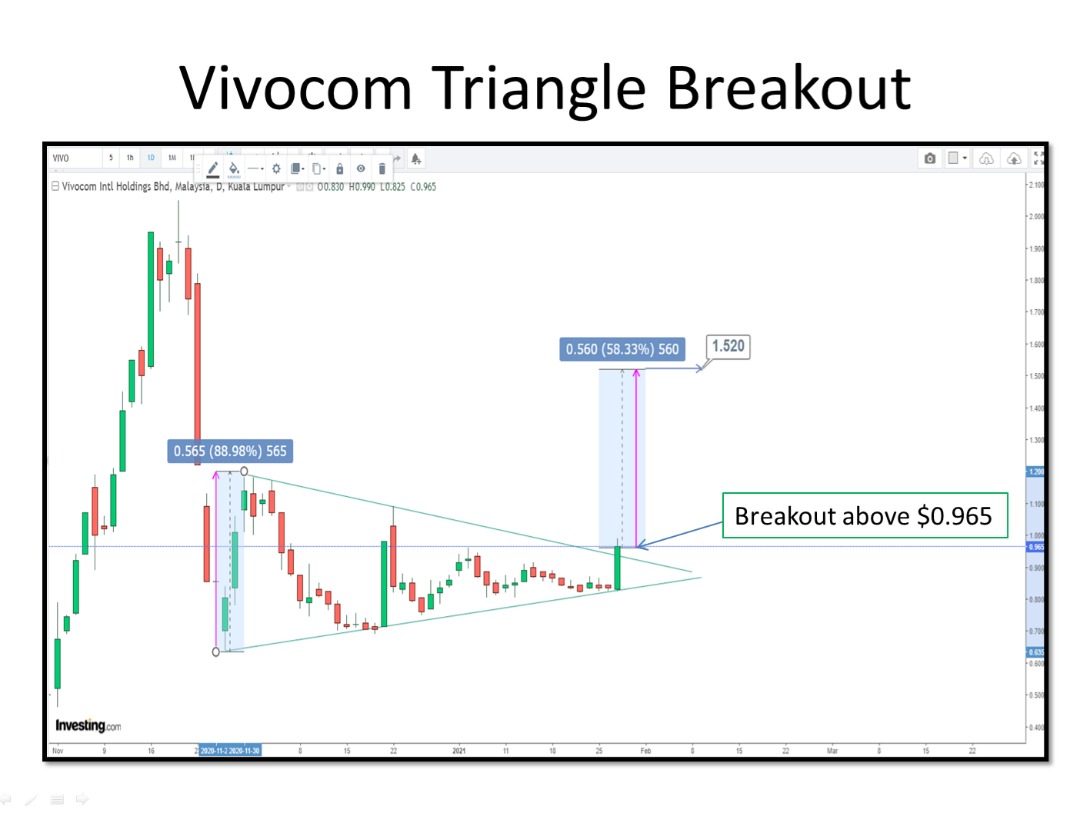
- This Vivocom triangle formation at 82/86c price levels had been in existence for the past three or four weeks.
- Finally Break Out yesterday with convincing volumes n conviction.
- So how can we take advantage of this? Very Simple.
- Place entry orders above the slope of the lower highs of the symmetrical triangle, Since we already know that the price is going to break out at higher levels, we can just hitch a ride in the direction of the Vivocom’s Rocket , which can only be upwards n higher.
- It already confirm breakout away from triangle formation and it is very likely the target of $1.52 will be reached in near term of time with high probability.
- I will buy on Friday market open and scale in more after break away from $1.00 as my target is aimed Vivocom reaching $1.52 or beyond.
The Super Bull is back. Ini Kali Lah!!!
Note the similarity of Vivocom’s Chart Formation to SUNW Chart formation below.
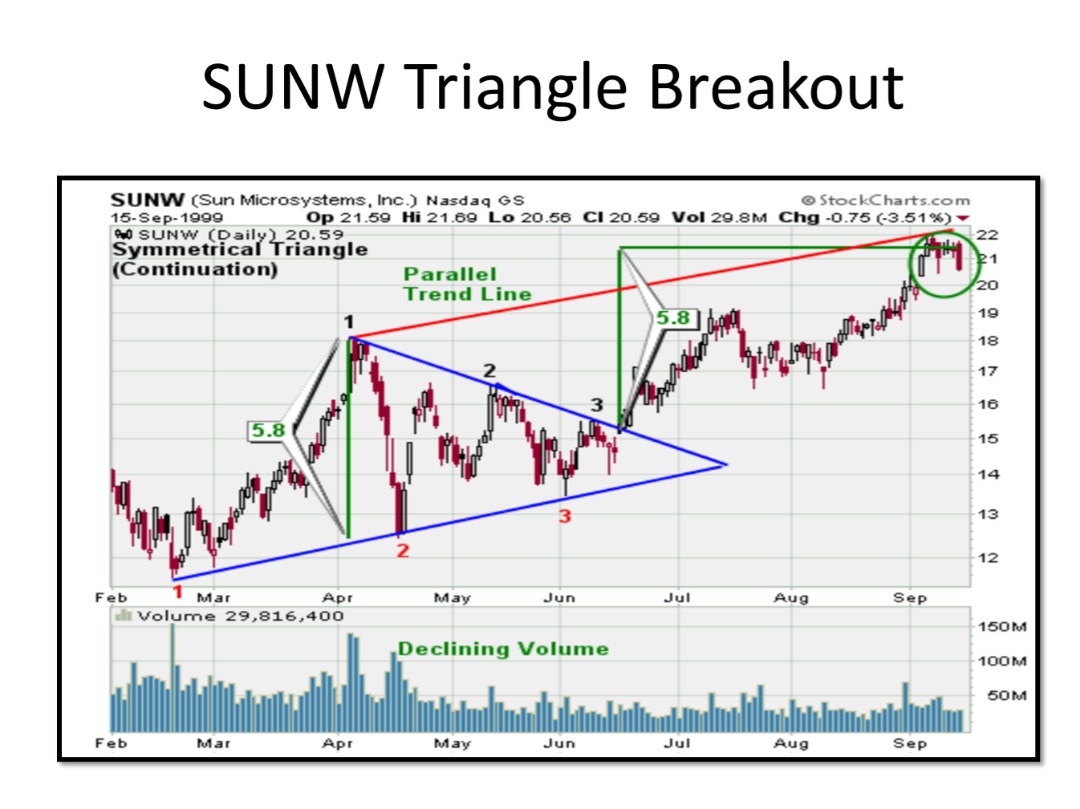
The SUNW’s chart show symmetrical triangle formation and it is similar to Vivocom’s Triangle Breakout chart formation.
- As we can see the price break away fr symmetrical triangle formation n heading to the target of $21
- The TP calculation was :- $15(breakout level) + $5.8 (triangle height) = $20.8
