Stock Review – SCIENTX (4731) (SCIENTEX BERHAD)
Company Profile
Scientex Berhad (SCIENTX) is a producer of industrial stretch film and a property development.. SCIENTX had two segment as follow:
i) Packaging Segment
Mainly focus in manufacturing of various packaging products, Include in this segment also the sales and marketing of laminating polyurethane adhesives.
ii) Property Development
In the business of constructing and developing residential, commercial and industrial properties and property management.
Income Statement

From the bar chart above around 70 % of SCIENTX revenue are derive from the packaging segment and had increased over the year. SCIENTX revenue from packaging segment stands 72.50 % as of 2020 compared to 70.40 % in 2016.

Although the property development segment only takes 30 % of the revenue, the property development segment contributes more profit to SCIENTX over the years compared to the packaging segment mainly due to property development giving a better profit margin. In 2020 there is a drop in property development contribution mainly due to the Movement Control Order (MCO) declared by Malaysia Prime Minister from 18 March 2020 to May 2020 where construction industry consider as non essential and unable to operate.
As both the operating segments are in different business segment and uncorrelated. Each segment would be analyzed individually.
Packaging Segment
The profit margin of the packing segment is negatively correlated (-0.70) with the crude oil price. Crude Oil price had increased to 60 USD per barrel which might decrease the profit margin of this segment.
In 2019 there is a spike in revenue 23.79 % compared to the average of 10 % growth year to year due to higher utilisation rate in the manufacturing plant. In 2019, there are two acquisitions in 2019, Mega Printing & Packaging in August 2019 and Daibochi Berhad in April 2019 which would further expand its packaging segment.
In 2020 despite the pandemic, SCIENTX packaging segment recorded an 43 % increase in profit mainly due to low crude oil price and higher revenue income. Revenue for 2020 had increased by 8.2 % from 2019.
Based on quarterly reports from 2018 to 2020, the packing segment is a non cyclical segment as the revenue is quite consistent at each quarter.
SCIENTX consists of 19 factories and 6 sales offices worldwide. Besides that SCIENTEX packaging products have been exported to more than 60 countries in the world.

Property Development
Malaysia Property Price Index growth had slowed down since 2017. In 2020 the price index shows a negative growth mainly due to the convid 19 and MCO. With the negative property price index growth rate and convid 19, SCIENTX profit from the property segment might be reduced.
Property development segment had growth slower 9.70 % 5 year CAGR of profit compared to the packaging segment which is 14.25 % CAGR.
Property development segment for SCIENTX show a cyclical segment according to the quarterly report from 2018 to 2020. SCIENTX property segment revenue is highest over the year for the Quarter close at 31July which is the Q4 of the SCIENTX financial year. The property development segment shows a consistent profit margin each quarter.
Overall Income Statement
SCIENTX has a healthy interest coverage ratio, SCIENTX is able to use their earnings before interest and tax to cover the interest expense.
SCIENTX Nett Profit growth is faster than the revenue growth is an indication SCIENTX able to be more efficient in operation throughout the years.
Balance Sheet
SCIENTX current ratio is more than one for the past 5 year.Asides that SCIENTX cash & Short Term Investment had increased by 60.39 % in 2020. 74.63 % of ash and short term investment for 2020 is in Ringgit Malaysia while 23.94 % in USD and 1.43 % in Japanese Yen.
SCIENTX's goodwill had increased by almost 5 times in 2019 due to the acquisitions of Mega Printing & Packaging in August 2019 and Daibochi Berhad in 2019.
10.71 % of the account receivable in 2020 had past to compared to 13.04 % in 2019.
There is a 2 times increase in total debt in 2018 due to issuance of RM 200,000,000 SUKUK for acquisition of lands and increase in foreign currency revolving credits. In 2018, 53.68% of the total debt is denominated in Ringgit Malaysia and 46.32 % is denominated in USD while in 2020, 46.67 % of the total debt is denominated in Ringgit Malaysia, 39.83 % is US Dollar, 11.95 % in Japanese Yen and 1.55 % in Australia Dollar.
Cash Flow
SCIENTX had positive cash flow from operation for the past 5 years with a CAGR of 13.47 %. Aside that , SCIENTX free cash flow has a 5 years CAGR of 44.18 %.
Dividend and Warrants
Dividends are adjust 2 :1 bonus issue in 2020 and 1:1 bonus issue in 2016. Besides that there is a 1 free warrant issue (SCIENTX-WC) for every 5 existing shares in 2020 with the exercise price of RM 4.3 expiring in 2024.
SCIENTX had paid dividend for the past 10 years. For the past 5 years SCIENTX dividend yield is lower than 10 years Malaysia Government Bond yield. As SCIENTX is considered a growth company, it retains about 70 % of its earnings for future growth.
Per Share Analysis
In 2020, SCIENTX had P/E of 12.02 which is lower than its 5 year average of 13.14. SCIENTX price is around 2 times its book value.
5 years CAGR for SCIENTX price is 7.43 % which is lower than its net income CAGR of 10.12 % and 5 years CAGR of cash flow from operation of 13.47 %.
Peer Analysis
Packaging
Property Development
Price / BV for SCIENTX is high compared to the peers. As packaging companies had P/BV average of 1.9 and property development companies had P/BV below 1. SCIETX is estimated to have P/BV below 2.0 since it operates in the packaging and property development.
Research Report
Average analyst target price is RM 4.15.
Technical Analysis
Daily Chart
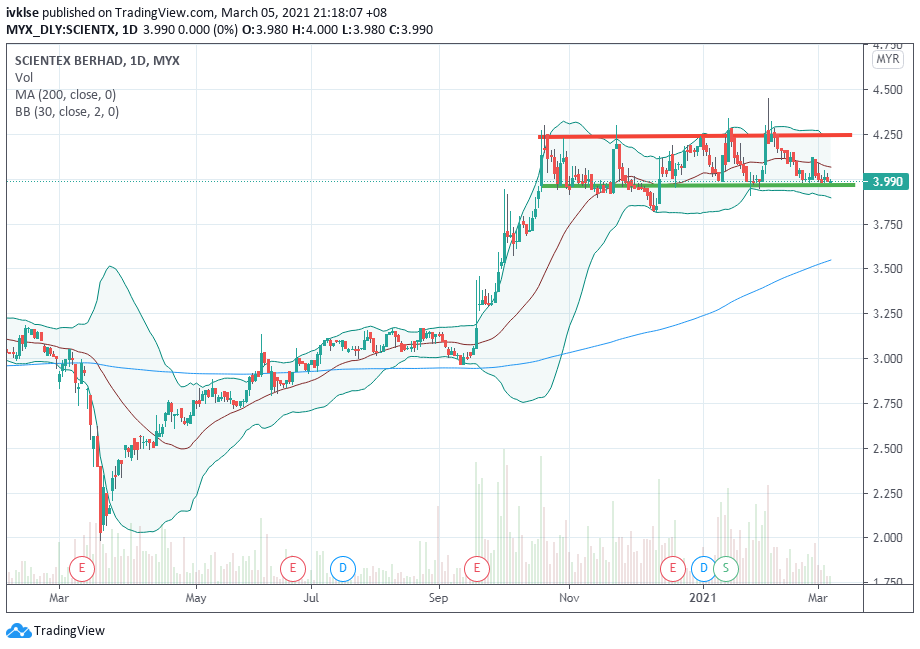
Daily chart show that SCIENTX price is testing the support level of RM 3.98. 200 days moving average show an uptrend.
Weekly Chart
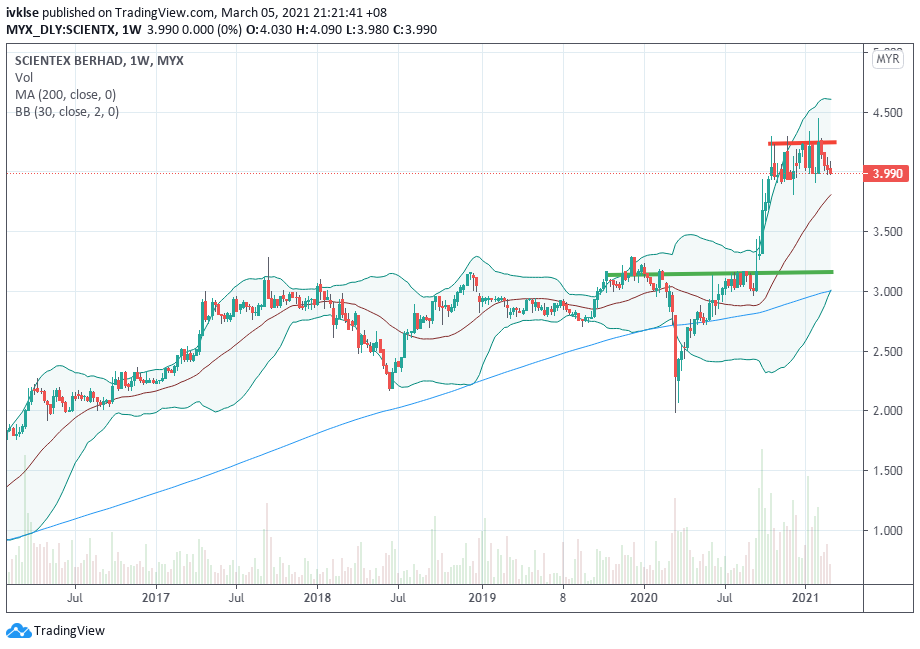
Weekly chart show that SCIENTX is testing the resistance level of RM 4.2. SCIENTX price trade at the upper band of the bollinger band which show and upward trend.
Monthly Chart
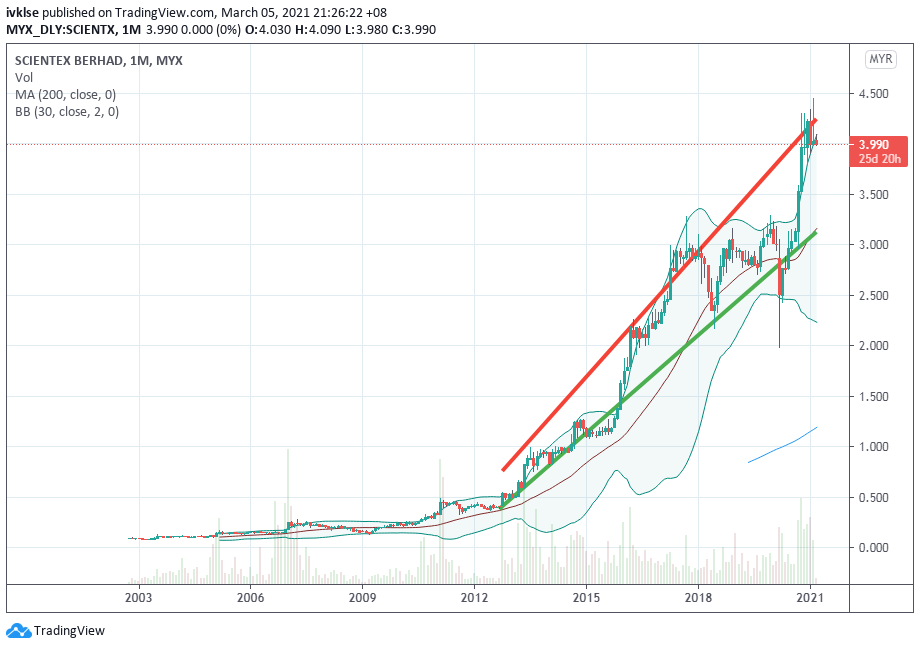
Monthly trend of SCIENTX shows at upward trend.
http://ivkls.blogspot.com/2021/03/stock-review-scientx-4731-scientex.html
