Disclaimer: All charts shared here are for educational purposes only. The opinions and information shared here are based on available data believed to be reliable and shall not be construed as an offer, invitation or solicitation to buy or sell any securities. Round & Surge does not warrant, represent and/or guarantee the accuracy of any opinions and information herein in any manner whatsoever and no reliance upon any parts thereof by anyone shall give rise to any claim whatsoever against Round & Surge and/or its associated person or entities.
Further disclaimer: We mainly apply this to larger share issue stocks or stocks that institutional funds preferred. We find it is much suitable for analysing bigger size stocks than small-mid size stocks. The operating methods are different between big & small-mid size stocks. Shall you want to know more about analysing small-mid size stocks, you may register in our website to view more videos with this link : https://bit.ly/2TxnMcr
What is Price & Volume Analysis?
We have to credit Richard D. Wyckoff for coming up with this analysis of identifying “Composite Man” (we refer to it as big boys) accumulation and distribution. How & when this “Composite Man” induces retail investors' decisions with demand & supply. Our Operator Analysis theory is based on The Wyckoff method and it helps us to develop & construct a much more detailed analysis that is suitable for the Malaysia market.
You may look up to him on google. However, do take note that this method was introduced a long time ago. With changes in regulation & market size, you may refer to his theory but the application will require adjustments to fit into the market or instruments that you are investing in. We will summarize the important components that we find applicable in the current market in this post.
Price & volume analysis is not just about identifying the formation of the daily price & volume from the chart. When you have a better understanding of how big boys work, you can even analyse the transaction patterns, time intervals, buy-sell queue formation, & other transaction data to get a better idea of the big boys' intention (aka tape reading) just like our Operator Analysis.
But in this post, we will not cover how to analyze the transaction data. Because it will have too much information to cover in 1 post. You may look into our posts & videos in the past to find some clues of how we read the transaction data at the link below :
When we talk about Price & volume analysis, we need to follow 3 important Wyckoff’s laws that move the price.
1) The Law of Supply & Demand determines the price direction
Compare the price & volume on the charts to study the balance between Supply & Demand. It requires lots of practice to understand the implication & accurately evaluate this simple law.
2) The Law of Cause & Effect
Every price movement today is because of yesterday's setup. It is the force of accumulation & distribution stage, also the price movement after the accumulation & distribution. Wyckoff also uses this law to gauge the price objectives. But along the history of how big boys operate, we find identifying the big boys' intention through price & volume at the high is much more reliable. However, we will still apply the cause & effect idea, except for the price objectives.
3) The Law of Effort
This law is for traders & investors to identify reversal. In a bullish scenario, a price hike with huge volume tally with the effort the big boys put in for the price up result. However, if we find the volume build up after a price rally (effort), but the price moves higher by a small margin (compared with a few days back.), a divergence in price & volume. This signals us the big boys are offloading.
Chart pattern formation by big boys changes, but their objective never changes. We need to understand the big boys objective & follow the 3 laws above. When they change their method, we will still be able to identify their intention.
Accumulation + Supply & Demand
Reminder again, this analysis is more suitable for bigger size stocks, investment instruments that have an accurate volume & price reflect the actual market, & with the rigid supply of units (such as share issue. Can’t issue new shares anytime.) We will add in some of our findings & understanding in this sharing. Therefore, it might have some difference from the original Wyckoff method.
Now is the best time to share about this method because the majority of the stocks in the market went through a market fall. Hopefully, this will help some of the investors and traders to have an idea of how to analyze the bottom and peak. The accuracy & result will purely depend on your practice.
(The Law of Supply & Demand determines the price direction) Every stock price falls because supply is more than demand & price moves higher because demand is more than supply. The person who can create such demand & supply that can move the market is the big boys (Composite Man).
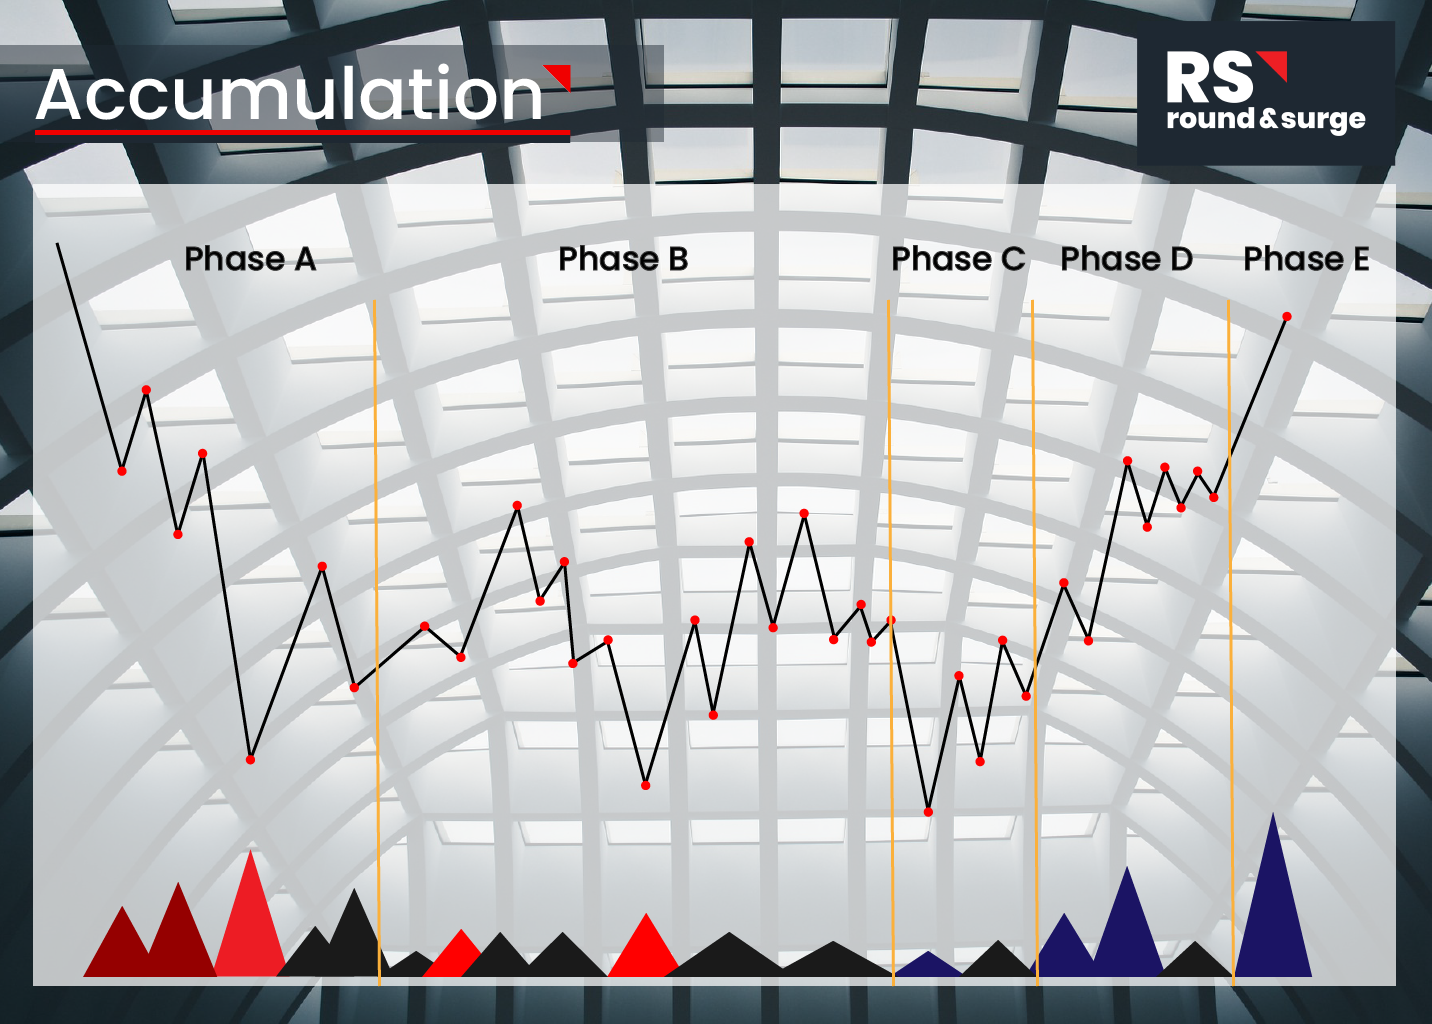
Phase A
When the price goes through a sharp fall is when big boys supplying (selling) shares in the market together with panic retail investors.
When the price reaches a selling climax (Red Triangle) is when the retail investors are panic selling & these shares sold will be absorbed by the big boys. USUALLY, this is indicating the price is near the bottom (sometimes it will form a lower low). You will see such a V shape rebound in many stocks. But this doesn’t mean it is a good point to move in because the big boys will take their time to absorb/reaccumulate the shares and it might go down lower.
Phase B
Big boys will start to accumulate the floating shares in the market slowly in this phase (may take more than a year). They will try to absorb it when the price is low. That is why you will still see high volume when the price hits the low but the volume is lower than previous phase A or previous low.
Big boys will start to proceed to phase C for testing any more selling pressure when the price increases with building up volume and price retrace with diminishing volume.
Phase C
Big boys will usually accumulate the majority of the shares, but It is important for the big boys to test any heavy selling before they continue to buy the price up. This is to avoid absorbing the selling pressure at the higher price, which will affect their profitability. Therefore, you will see a sudden price fall and set a new lower low to create fear in the market. If there is still selling pressure in the market, they will feel fear of losing more and choose to cut loss here.
According to the Law of Effort, prices fall with huge volume indicating heavy selling (bearish). But if the big boys initiate testing by pressing the price lower to form a new low (blue volume), there's not much selling pressure (low volume). This indicates not many sellers are in the market, even with the price fall it doesn’t shake the seller out. If all the above is set in, then it is a good time to initiate a partial position.
Take note: Sometimes they don’t test.
Phase D
With low supply in the market & high demand created by the big boys, the stock price will continue to move higher with volume increasing and price retrace with diminishing volume. With demand dominance, the price will move at least to the previous high in phase B. The first retrace when it enters into phase D will be a good point for an additional long position.
Phase E
Price will continue to “Markup” by the big boys at this phase & will start to distribute on the way up by markup prices then wait for retail investors to queue in the buy queue and sell it down to them, that’s why you will see price retrace in every uptrend. That’s big boys take profit.
Actual Market
Above are the theory & examples of identifying accumulation (bottom) with price & volume analysis. In the actual stock market, you will rarely see such nicely formed chart patterns.
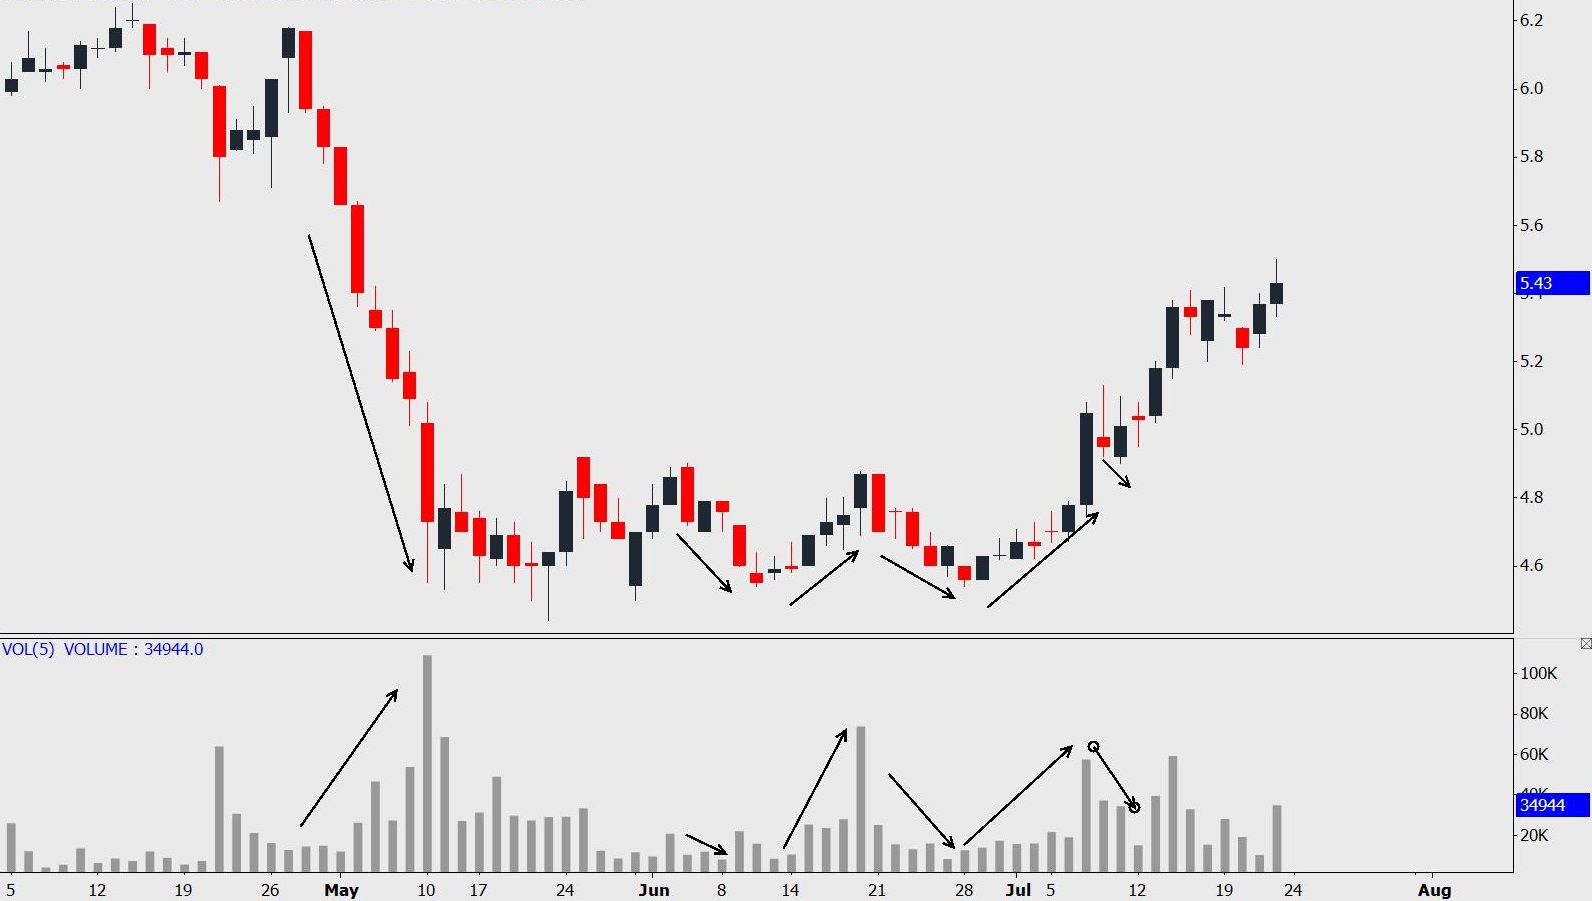
All you need to remember and practice analysing the price & volume of the stocks with Wyckoff’s Laws. A stock market is a place we call a “free market” in economic terms, where prices are affected by supply & demand and 1 day it will come to a balance point. When you see a price is down with high volume means that the supply is high. If you think these stocks are good for rational reasons (not because of your biased behaviour), then you may monitor for any divergence in the price & volume to identify selling pressure is drying up. Then we need to watch for any demands coming in and check if the price & volume fulfilling the Law of Effort with price up with volume building up.
This is how we apply a set of rules or laws to analyze the unpredictable stock market. Formation changes but the objective of the big boys doesn't change. Don’t learn the pattern, learn the core of the analysis.
Give us a like and share with your trading buddy if you want us to share the 2nd half of this Wyckoff’s method in our next post.
If you are interested to find out more about how to read the big boys' transaction data at the link below : https://youtu.be/YlPG8A4xUC4
Trading Account Opening
They are offering IntraDay trade brokerage rate at 0.05% or RM8 whichever is higher for day trading stocks RM 50,000 & above transacted volume (buy sell the same stocks in the same day). Buy & hold at 0.08%or RM8 whichever is higher.
Open a cash account now at the link below :
https://registration.mplusonline.com/?ref-id=R311
As Kelvin’s trading client, you will be exclusively invited to join Kelvin’s weekly webinar and telegram group.
For more inquiry contact him by email: kelvinyap.remisier@gmail.com or 019-5567829
If we have missed out on any important information, feel free to let us know and feel free to share this information out but it will be much appreciated if you can put us as the reference for our effort and respect, thank you in advance!
Find out more about how we track big boys effectively in our Facebook and YouTube Channel:


This blog is for sharing our point of view about the market
movement and stocks only. The opinions and information herein are based
on available data believed to be reliable and shall not be construed as
an offer, invitation or solicitation to buy or sell any securities.
Round & Surge and/or its associated persons does not warrant,
represent and/or guarantee the accuracy of any opinions and information
herein in any manner whatsoever and no reliance upon any parts thereof
by anyone shall give rise to any claim whatsoever against Round &
Surge. It is not advice or recommendation to buy or sell any financial
instrument. Viewers and readers are responsible for your own trading
decision. The author of this blog is not liable for any losses incurred
from any investment or trading.
https://klse.i3investor.com/blogs/rns810/2021-07-25-story-h1568761217-Identify_Market_Bottom_with_Price_Volume_Analysis_Wyckoff_Method.jsp
