Bursa Malaysia - 7167
Bloomberg - JOHO:MK
Reuters - JHTN.KL
Webpage - http://www.johoretin.com.my/
Yahoo - 7167.kl
Company Profile
Johore Tin Berhad (JOHOTIN) was incorporated in Malaysia on 22nd November 2020. JOHOTIN involved in two segments:
Tin Cans Manufacturing
21.72 % of 2020 revenue
Manufacturing of various tins, cans and other containers and providing tin plate services.
Most customer are locally base, with minor market shares in Singapore
Customer base consists of various industries mainly in biscuits, paint and chemical, edible oil and food processing industries.
Food & Beverage
78.28 % of 2020 revenue
Manufacturing and selling of milk and other related dairy products, as well as packing and trading of all types of dairy products.
Dairy products comprise of sweetened condensed milk, evaporated milk and milk powder with the brand name Able Farm, Able LAC, Able Mama.
80 % of the dairy products are exported, mainly to West Africa, South East Asia Region and American Continent.
Income Statement

JOHOTIN revenue had increased for the year 2016 to 2019 with a CAGR of 7 % before the Convid 19 pandemic. In 2020 the revenue had dropped from RM 579,790,000 in 2019 to RM 520,260,000, a drop of 10.23 % due to the factory being unable to operate at full capacity during Movement Control Order by Government of Malaysia in March 2020.
From the Q1 2021 financial report, JOHOTIN is recovering from the drop in revenue due to pandemic in 2020. Despite lower revenue in Q1 2021 the profit from Q1 2021 is on par with the profit before the pandemic due to higher profit margin.
Balance Sheet
JOHOTIN percentage of account receivable past due had reduced from 33.18 % in 2016 to 25.15 % in 2020. Asides that, JOHOTIN total debt and debt to equity ratio had also reduced. JOHOTIN has a strong current ratio of 2.94 in 2020 while 32.96 % of the current assets are cash.
Cash Flow
JOHOTIN CAGR of cash flow from operation is -9.96 % and CAGR of free cash flow is - 8.11 %.
Per Share Analysis
JOHOTIN had lower book value per share compared to its current price. Asides that its price had increase with CAGR of 10.32 % while its free cash flow had decrease with CAGR of -8.11 %.
Dividend
JOHOTIN has a dividend payout of around 40 % and dividend yield match with 10 year Malaysia Government Bond.
Dupoint Analysis
Net Profit Margin of JOHOTIN is around 8 % over the 5 years except 2017. Net profit margin for 2020 stayed around 8 % despite convid 19.
Asset turnover of JOHOTIN had reduced from 1.28 in 2019 to 1.07 in 2020 maybe due to convid 19. Asset turnover of JOHOTIN might increase after the recovery of the economy.
Equity Multiplier or Financial Leverage of JOHOTIN had decreased from 1.54 in 2016 to 1.32 in 2020 which means the company had reduced its debt over the five year.
Growth Rate
JOHOTIN had growth rate of 7 %
Capital Asset Pricing Model (CAPM)
Research Report
Peer Analysis
JOHOTIN had lower P/E compared to its peers. Asides that It had a higher dividend yield.
Technical Analysis

JOHOTIN daily chart show a downward trend with a support level at RM 1.48. Price might go upward if it is above the Ichimoku cloud at RM 1.625.
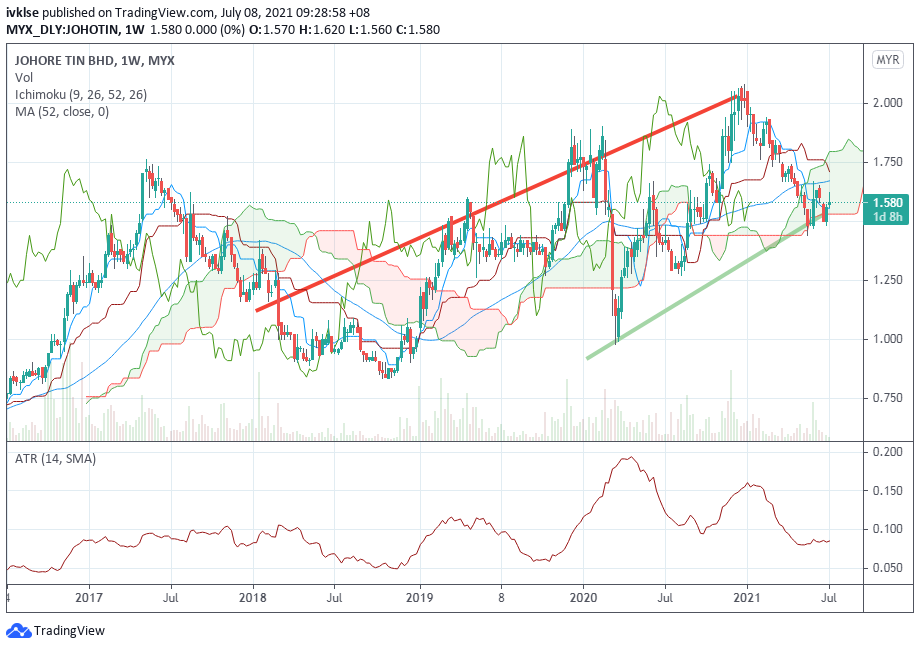
JOHOTIN charts is testing it to support RM 1.53. JOHOTIN going downtrend if price is below RM 1.53.
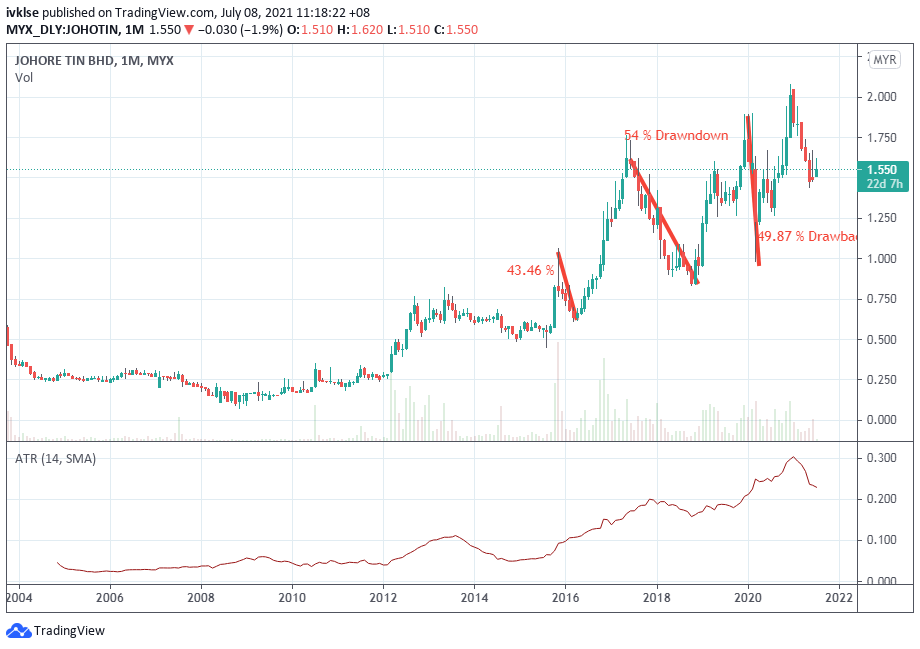
Maximum drawdown for JOHOTIN is 54 %.
Summary of Industry Comparison
http://ivkls.blogspot.com/2021/07/stock-review-johotin-7157-johore-tin.htm
