HIBISCS (5199) HIBISCUS PETROLEUM BHD buy Hibiscus
Hibiscus announced the purchase of Repsol’s assets in South East Asia on 3 June 2021. Repsol announcement of the disposal was a day earlier.
Since the announcement, the response from the market has been muted.
One of the main concerns assumed is oil price direction.
Oil price, rising or falling?
As per all commodities, oil price changes / volatilities depended on:
a) Supply – capital investment into exploration, production and so on to replace as well as add to current stock for continuous economic development and wellbeing
b) Demand – current pandemic rising cases, EVs and use of renewable / alternatives instead of fossil fuels
c) Geo-political issues – Iran potential return to supply and so on
Let’s go through the above in order of least importance:
1) Geo-political issues – this has been around forever and can never be ideally solved. Solving one here often create another issue somewhere else, so, live with it.
2) Demand
– EVs, renewal / alternatives to fossil fuels, YES, in at least 20 or more years down the road. Ignore it for a 10 years’ time horizon.
– Covid 19 cases: vaccines are being roll out and cases is coming down. US and Europe are removing restriction and air-travel is picking up. Going forward, demand will go up.
3) Supply
– since 2015, capital investment (CAPEX) has been reduced. While some investment came back, it was further reduced in 2020 and into 2021. Now, there is a new headwind – New Green Deal, more on this later.
– Depletion, this very much ignored point is important and in this environment of reduced CAPEX, eats into the spare capacity.
Supply
Depletion
A direct way to see the effect of reduced CAPEX is the number of oil rigs operating worldwide. This data is obtained from Baker-Hughes. Supply or production data is from EIA – US Energy Information Administration.
Depletion rate is 5 to 7% as per Geological Survey of Finland (Report) “Oil from a Critical Raw Material Perspective” (http://tupa.gtk.fi/raportti/arkisto/70_2019.pdf). This is a robust report and have a good section on shale oil – section 7 (pages 138 to 155). PLEASE read it.
From the following three graphs, the rig productivity is estimated to be:
1988 to 2014 – 2.22 kb/d/rig/yr
2015 to 2019 – 2.76 kb/d/rig/yr
A 5% depletion rate was used to be conservative.
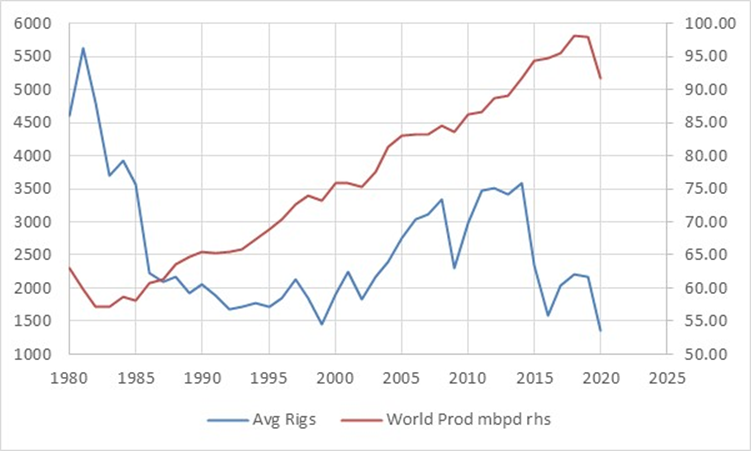
Graph 1: World average rigs per year and oil production
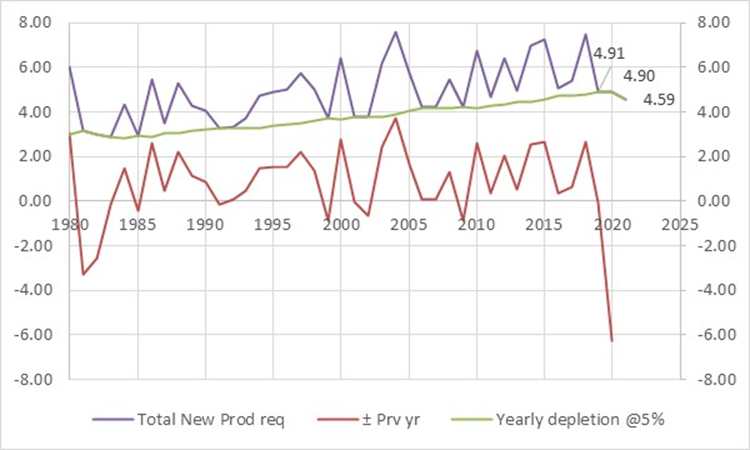
Graph 2: Estimated yearly new production required
Depleted amount is calculated from the previous year production, i.e., for year 2020, the 4.9 mb/d is 5% of 98 mb/d, 2019 production. Hence, new production required for the year would be the depleted amount plus the increase in year-to-year production.
Rig productivity is calculated from the new production required divided by the average of the current and previous year number of rigs to allow for the lag in production coming on-stream.

Graph 3: Estimated average rig productivity over 2 time period
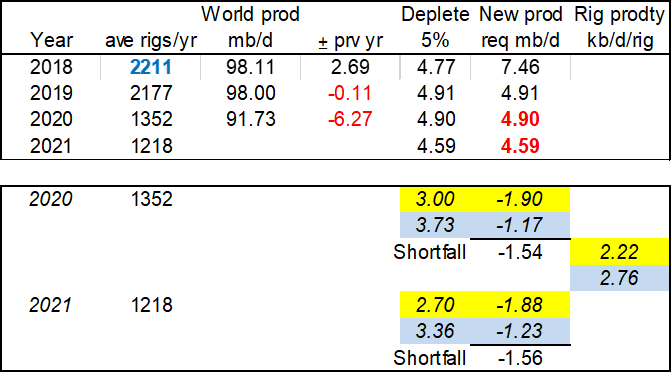
For year to year where there is reduced production, like 2019 and 2020, the reduction differences are not deducted from the depleted amount. Thus, for year 2020 and 2021, the calculated shortfall will eat into the spare capacity.
Estimated shortfall is about 1.54 mb/d for 2020 and 1.56 mb/d for 2021. That is cumulative 3.1 mb/d less spare capacity, worldwide.
Going forward, there will always be a ±5 mb/d depletion per year that need to be replaced. Using the rig productivity rates gives 2254 to 1813 i.e., average 2000 rigs per year is needed.
Shale Oil
In oil supply matrix (abstract of Report), shale oil since 2005, contributed 71.4% of new oil supply, and, accounted for 98% of global oil production growth in 2018.
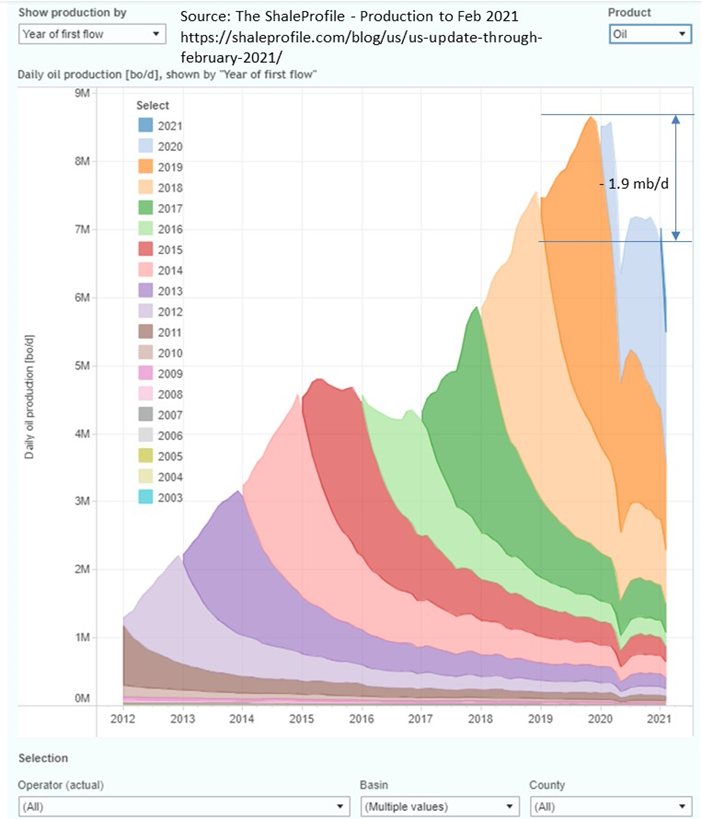
March 2021 shale oil production is at 6.9 mb/d, indicated that shale oil has lost 1.9 mb/d from its peak at end of 2019. February 21 production was at 6 mb/d due to the freeze.
On page 153 of the Report, average well production decline is 86.8% while average field decline is 26.3% (with maintenance drilling).
Shale oil production and the average yearly oil rigs are as shown in the next graph.

It is estimated just to maintain the same shale production of 2019, at least 850 rigs are needed to be deployed. Currently there is only about 457 (28 May 21) on site.
There are two further issues that hamper the increasing of shale oil production: -
a) “High-grading” of the area well drilled since 2016. Wells were drilled in areas with the best prospect (Tier 1) so as to increase production with the least number of wells. Going forward, the remaining prospective areas are of lower quality. This means more rigs are required.
b) Low to almost junk rating of most of the shale oil (independent) companies, with some already bankrupt. Thus, they are not able to raise fresh fund to increase drilling. All free cash flow is used to reduce borrowings to improve rating.
New Green Deal
Oil majors (Shell, Exxon, Total etc.) face major hurdle to become carbon neutral. Some even face court cases while Exxon has three new directors that are “greenies”.
Board room meeting on new oil & gas CAPEX investment would be most interesting going forward. It is likely that CAPEX would be directed to renewables / alternatives to fossil fuel, this further exasperating the already much reduced CAPEX since 2015.
Summary
1) Depletion rate is 5 to 7%
2) CAPEX is reduced and this is reflected in the low number of rigs in operation currently
3) Low rigs number caused cumulative replenishment shortfall of 3.1 mb/d in 2021, i.e., spare capacity will be less by 3.1 mb/d
4) Shale oil depletion is much higher – 26 to 87%.
5) Based on March 2021 production, shale oil has dropped about 1.9 mb/d from 2019 peak to about 6.9 mb/d (March 21). Current rig numbers are not able to replace depleted oil.
6) Rigs number need to increase to 2000 rigs from current 1200 worldwide to maintain production.
7) Rigs in US need to increase to 850 from current 457 (28 may 2021) to maintain production at around 7 mb/d. Actually more than 850 is required as new areas are of lower quality / tier.
8) New Green Deals may cause further reduction in oil / gas CAPEX.
CONCLUSION
With geopolitical issues, need to live and accept the volatility that comes with it. As for demand, it is going up due to the roll out of vaccines while EVs etc. will not affect demand for the near future (next 5 years).
CAPEX has been reduced since 2015 and now with New Green Deal, it appears to remain relatively low in the years to come. The low CAPEX is reflected in the reduced number of rigs in operation. Rigs number need to be increased to 2000 worldwide to maintain production.
Unless rigs number goes up FAST, oil price is on an upward trend as spare capacity is being reduced.
Have a safe day and a good week ahead, stay at home.
Declaimer:
Nobody paid me to write this. I own Hibiscus shares. This article in no way promote buying or selling of Hibiscus or any other securites / equities / assets. Always do you own due diligent before investing in anything.
https://klse.i3investor.com/blogs/ZZD/2021-06-14-story-h1566198270-Hibiscus_buy_Hibiscus.jsp
