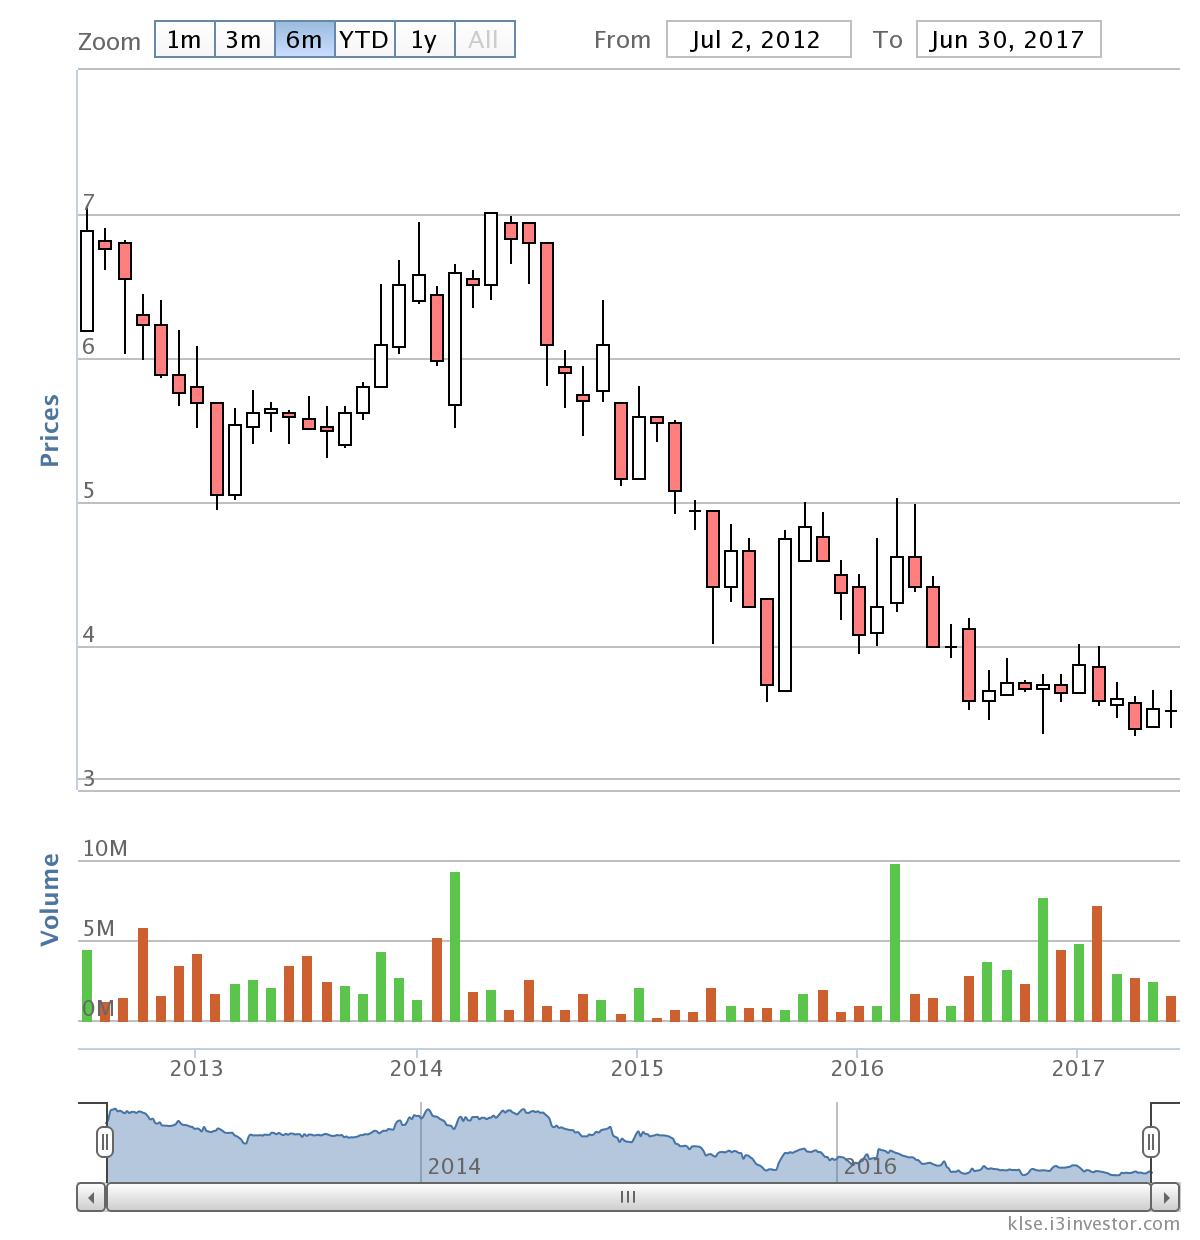
Sarawak Oil Palm Berhad http://klse.i3investor.com/servlets/stk/nb/5126.jsp is involved primarily in the cultivation of oil palms and operation of palm oil mills. It was listed in Bursa Malaysia since 1991 with a partial public ownership under the entity Pelita Holdings Sdn. Bhd.. For the past decade or so, the company has been very active in its capital investment namely with the addition of three extra palm oil mills totalling 210 TPH capacity excluding the palm oil mill included in its recent purchase of Shin Yang Oil Palm Berhad. Nonetheless, a major concern among investors on the growth of its revenue is its profit margin deterioration coupled with its position from a net cash company to a net debt company. As recent as 2014, the company also incorporated SOP Green Energy Biodiesel Plant which unfortunately happened at a time when the oil price crashed.
Referring to historical financial figures below, one can understand why the stock price has been on a declining trend for the past half of the decade.
|
|
2008 |
2009 |
2010 |
2011 |
2012 |
2013 |
2014 |
2015 |
2016 |
|
Revenue |
683250 |
533304 |
728158 |
1166949 |
1314943 |
1711402 |
2874718 |
3670787 |
4416122 |
|
Growth YoY% |
|
-21.95% |
36.54% |
60.26% |
12.68% |
30.15% |
67.97% |
27.69% |
20.30% |
|
EBIT |
217078 |
140694 |
219732 |
357648 |
214606 |
156420 |
183548 |
149239 |
218816 |
|
Growth YoY% |
|
-35.19% |
56.18% |
62.77% |
-40.00% |
-27.11% |
17.34% |
-18.69% |
46.62% |
|
EBIT Margin |
31.77% |
26.38% |
30.18% |
30.65% |
16.32% |
9.14% |
6.38% |
4.07% |
4.95% |
|
Net debt (Debt - Cash) |
-27237 |
-28928 |
-63247 |
-91991 |
74719 |
342965 |
443495 |
661113 |
452220 |
 Industry Analysis
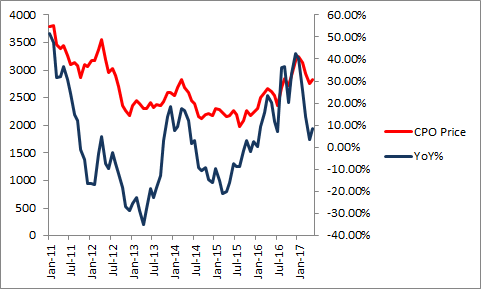
On the industry level, crude palm oil price trend has been analogous to
SOP's price trend up until 2016 where despite an uptrend in crude palm
oil price, SOP is penalized by the market due to the fall in output.
Concurrently, the market is expecting global palm oil output to
increase significantly (approximately 10%) as the weather is expected to
be favourable around palm oil-producing nations. To make things worse,
global markets are forecasting soybean output (a common substitute of
palm oil) in USA, Brazil and Argentina to increase significantly despite
unfavourable weather forecast in 2017 (I don't know why such paradox
appear). Additionally, Malaysian palm oil export share has been
declining from 46% in 2011 to 37% in 2016 while Indonesia's palm oil
export share has been increasing. (Data from MPOC) In other words, the
market's outlook towards palm oil industry especially Malaysian palm oil
industry is currently very pessimistic. However, one can interpret
differently given the data below.
|
Production (tonnes) |
2010 |
2011 |
2012 |
2013 |
2014 |
2015 |
2016 |
|
Crude Palm Oil |
16993717 |
18911520 |
18785030 |
19216459 |
19666953 |
19961581 |
17319177 |
|
Growth YoY% |
|
0.11285365 |
-0.0066885 |
0.02296664 |
0.02344313 |
0.01498087 |
-0.1323745 |
|
Crude Palm Kernel Oil |
2014943 |
2144699 |
2164024 |
2269822 |
2277382 |
2276466 |
1959423 |
|
Growth YoY% |
|
6.44% |
0.90% |
4.89% |
0.33% |
-0.04% |
-13.93% |
|
Closing Stocks (tonnes) |
2010 |
2011 |
2012 |
2013 |
2014 |
2015 |
2016 |
|
Palm Oil |
1616237 |
2058400 |
2627419 |
1987111 |
1902306 |
2633940 |
1666673 |
|
Growth YoY% |
|
27.36% |
27.64% |
-24.37% |
-4.27% |
38.46% |
-36.72% |
|
Palm Kernel Oil |
245184 |
285592 |
374102 |
343705 |
299033 |
336328 |
222615 |
|
Growth YoY% |
|
16.48% |
30.99% |
-8.13% |
-13.00% |
12.47% |
-33.81% |
Due to ElNino, production of crude palm oil fell significantly and the
constant demand for it shrank inventory stockpile very significantly.
Thus, the expected increase in output this year in my opinion only
compensates not even all but a major part of past year production
decline. It is up to the market on how it wants to price CPO but I
personally believe CPO price will rebound in the mid-future. Similarly,
the market may have penalized the industry's valuation due to its
beliefs about the dependence of CPO demand on China yet there may be
another more important customer in this business.
|
Malaysia Palm Oil Exports to Selected Destinations (tonnes) |
2010 |
2011 |
2012 |
2013 |
2014 |
2015 |
2016 |
|
China |
3484779 |
3982128 |
3513908 |
3714517 |
2856873 |
2391369 |
1889566 |
|
EU |
2064208 |
2005863 |
2226848 |
2336759 |
2539869 |
2614295 |
2116650 |
|
Pakistan |
2134604 |
1821099 |
1343254 |
1435217 |
815618 |
706935 |
880455 |
|
India |
1169998 |
1667908 |
2639930 |
2325386 |
3251564 |
3686315 |
2825840 |
|
US |
1028048 |
1054997 |
1029443 |
1012135 |
783105 |
703482 |
590030 |
|
Others (Others, Philipines, Japan, Vietnam, Turkey) |
4783431 |
7461360 |
6822103 |
7322809 |
7787281 |
8107431 |
8401125 |
|
Total |
9881637 |
10531995 |
10753383 |
10824014 |
18034310 |
18209827 |
16703666 |
|
Growth YoY% |
|
6.58% |
2.10% |
0.66% |
66.61% |
0.97% |
-8.27% |
Sure enough, China is indeed still a significant customer but India is
currently playing the most important role. If one believes that the
Indian consumption power will increase over time given its ongoing
structural reform, the quantity of palm oil demanded shall increase. On
the other hand, some people are concerned about European Union's
decision to continue its import of palm oil products given its high
standards of environmental protectionism and etc. but that has been
factored into the current price already (IOI Group dispute). From
another side of the market, an increase in crude oil price can also be a
catalyst for CPO due to the return to biodiesel standard in several
countries.
Company Output Performance
As mentioned above that SOP valuation was penalized by output decline,
their recent increase in output due to acquisition of ShinYang Oil may
be a potential catalyst for the stock in the mid-term.

As shown above, SOP's output (industry output too probably) is seasonal
with September to February showing declining output while March to
August showing increasing output. One can also note that in 2016, annual
output is indeed lower due to weather issues but an important point to
observe is its output since December 2016. Despite September to February
being a declining period, SOP output increased from January due to the
incorporation of ShinYang Oil and this can be deemed the "New Low". In
coming quarters, output is very likely to be above those achieved during
the peak years of 2014 and 2015. Similarly, yield per hectare (in terms
of FFB / Mature Palms) in 2017 should be able to outperform last year's
yield per hectare given favourable weather condition and probably less
tree stress. Based on historical precedence, it is quite likely to
happen.
|
Yield Per Hectare |
2008 |
2009 |
2010 |
2011 |
2012 |
2013 |
2014 |
2015 |
2016 |
|
Tonnes FFB / Mature Palms |
23.11 |
21.25 |
19.87 |
20.37 |
18.21 |
17.09 |
17.5 |
18.55 |
16.79 |
|
Crude Palm Oil / FFB |
0.2091 |
0.2157 |
0.2123 |
0.209 |
0.2067 |
0.2014 |
0.2026 |
0.1988 |
0.1997 |
|
Palm Kernels / FFB |
0.0436 |
0.0437 |
0.0438 |
0.0429 |
0.0439 |
0.0435 |
0.0439 |
0.0427 |
0.042 |
Infact, the age profile of SOP's plantation is very favourable so
investors are rest assured that growth in the incoming years will be
significant unless weather disruption becomes a disasterous phenomena.
|
Age Profile |
2008 |
2009 |
2010 |
2011 |
2012 |
2013 |
2014 |
2015 |
2016 |
|
Immature |
33.34% |
41.45% |
42.52% |
30.94% |
28.70% |
12.70% |
5.30% |
3.89% |
12.11% |
|
Young (4 - 10 years) |
46.45% |
38.25% |
33.94% |
36.99% |
39.70% |
50.90% |
53.10% |
54.02% |
51.38% |
|
Prime (11 - 20 years) |
14.13% |
15.32% |
16.67% |
24.17% |
23.80% |
26.80% |
31.90% |
33.48% |
31.90% |
|
Old (21 & Above) |
6.08% |
4.98% |
6.87% |
7.91% |
7.80% |
9.60% |
9.70% |
8.62% |
4.61% |
The incorporation of ShinYang Oil's plantation since 2016 December made
the proportion of ages change as it consist mainly young plantations
(which is a good thing). For clarification purpose, I have also provided
the numerical figures of the plantation.
|
Detailed Age Profile (hectares) |
2008 |
2009 |
2010 |
2011 |
2012 |
2013 |
2014 |
2015 |
2016 |
|
Immature |
14837.97 |
22487.45 |
25061.29 |
18236.04 |
18155.91 |
8068.31 |
3358.981 |
2470.811 |
10625.8 |
|
Young (4 - 10 Years) |
13779.39 |
12150.5 |
11497.85 |
12531.1 |
17907.48 |
28211.83 |
31858.41 |
32978.67 |
39621.69 |
|
Prime (11 - 20 years) |
4191.665 |
4866.551 |
5647.296 |
8188.071 |
10735.47 |
14854.17 |
19139.04 |
20439.21 |
24599.69 |
|
Old (21 & Above) |
1803.632 |
1581.947 |
2327.35 |
2679.671 |
3518.346 |
5320.896 |
5819.709 |
5262.424 |
3555.002 |
Company Free Cash Flow
Looking through the company's financial performance, it is probable
that the market is valuing the company appropriately due to its high
capex requirement (whether a huge proportion of capex all these while is
considered maintenance capex or growth capex is an important question
here). Boiling down tho, capital expenditure as a proportion of sales
has been declining so free cash flow may soon be well positive again.
|
|
2008 |
2009 |
2010 |
2011 |
2012 |
2013 |
2014 |
2015 |
2016 |
|
CAPEX |
-164749 |
-146248 |
-138650 |
-234847 |
-221253 |
-157276 |
-162349 |
-108894 |
-344750 |
|
% of Sales |
24.11% |
27.42% |
19.04% |
20.12% |
16.83% |
9.19% |
5.65% |
2.97% |
7.81% |
|
Net Cash Flow from Operations |
199605 |
167797 |
211183 |
293761 |
99223 |
168640 |
89636 |
-90793 |
255855 |
|
Free Cash Flow |
34856 |
21549 |
72533 |
58914 |
-122030 |
11364 |
-72713 |
-199687 |
-88895 |
The latest capex for 2016 includes RM284432417 for the acquisition of
ShinYang Oil and I believe the company will tread with more caution now
in terms of their capital expenditure given that their debt as a
proportion of asset is currently at 43% (quite high which may explain
why they conducted rights issue to raise funding although equity cost of
capital is higher than debt cost of capital) and is unlikely to conduct
additional equity fundraising which may upset shareholders (a little
more on this later). Hence, I believe capital expenditure requirement
will revert back to the average of 2013 to 2015 which gives
approximately RM140 mil. For precautionary purposes, I decide to
escalate capital expenditure requirement by 15% which gives RM161 mil.
Free cash flow is projected under the assumption that
i) Net cash flow from operations grow at 15% while CAPEX grows at 5% for the first 5 years.
ii) Terminal growth is assumed to be 3% to reflect inflation rate
iii) Cost of Capital of 10% (refer to below)
|
|
2017 |
2018 |
2019 |
2020 |
2021 |
Terminal |
|
Net Cash Flow from Operations |
294233.3 |
338368.2 |
389123.5 |
447492 |
514615.8 |
7351654 |
|
CAPEX |
-161228 |
-169289 |
-177753 |
-186641 |
-195973 |
-2799615 |
|
FCFF |
133005.8 |
169079.4 |
211370.2 |
260851 |
318642.8 |
4552039 |
|
Discount rate |
1.1 |
1.21 |
1.331 |
1.4641 |
1.61051 |
1.771561 |
|
NPV |
120914.3 |
139735 |
158805.5 |
178164.7 |
197852.1 |
2569508 |
Cost of Capital
|
Market Capitalization |
2030000 |
As an equity holder, i demand 15% returns as I am very risk-averse and
the company has higher financial distress risk. Conclusively, this gives
an intrinsic value per share of RM4.50. Based on current price, this
provide approximately 20% margin-of-safety.
Valuation Ratios
|
Company |
SOP |
Boustead |
IJMPlant |
TSHResources |
HapSengP |
|
Total Planted Area (Hectares) |
87744 |
64500 |
59595 |
42103 |
36145 |
|
Entreprise Value |
2916460 |
3115631 |
3144100 |
3929451 |
1915405 |
|
Earnings Yield |
7.50% |
4.59% |
2.28% |
3.10% |
8.73% |
|
Price-to-book ratio |
0.991139 |
1.17833 |
1.663874 |
1.57533192 |
1.018068 |
|
Price-to-earning ratio |
9.277201 |
18.25481 |
37.21663 |
19.4880888 |
12.42626 |
|
CFFO / Price |
12.60% |
5.34% |
2.13% |
5.54% |
7.41% |
|
ROE |
7.01% |
10.40% |
13.06% |
4.20% |
6.80% |
