What is Piotroski score?
--------------------------------
The Piotroski score is a discrete score between 0 - 9 which reflects nine criteria used to determine the strength of a stock. The nine criteria covers the areas of profitability, capital structure/financial liquidity, and operating efficiency.
For every criteria that is met the company is given one point, if it is not met, then no points are awarded. The points are then added up to determine the best value stocks.

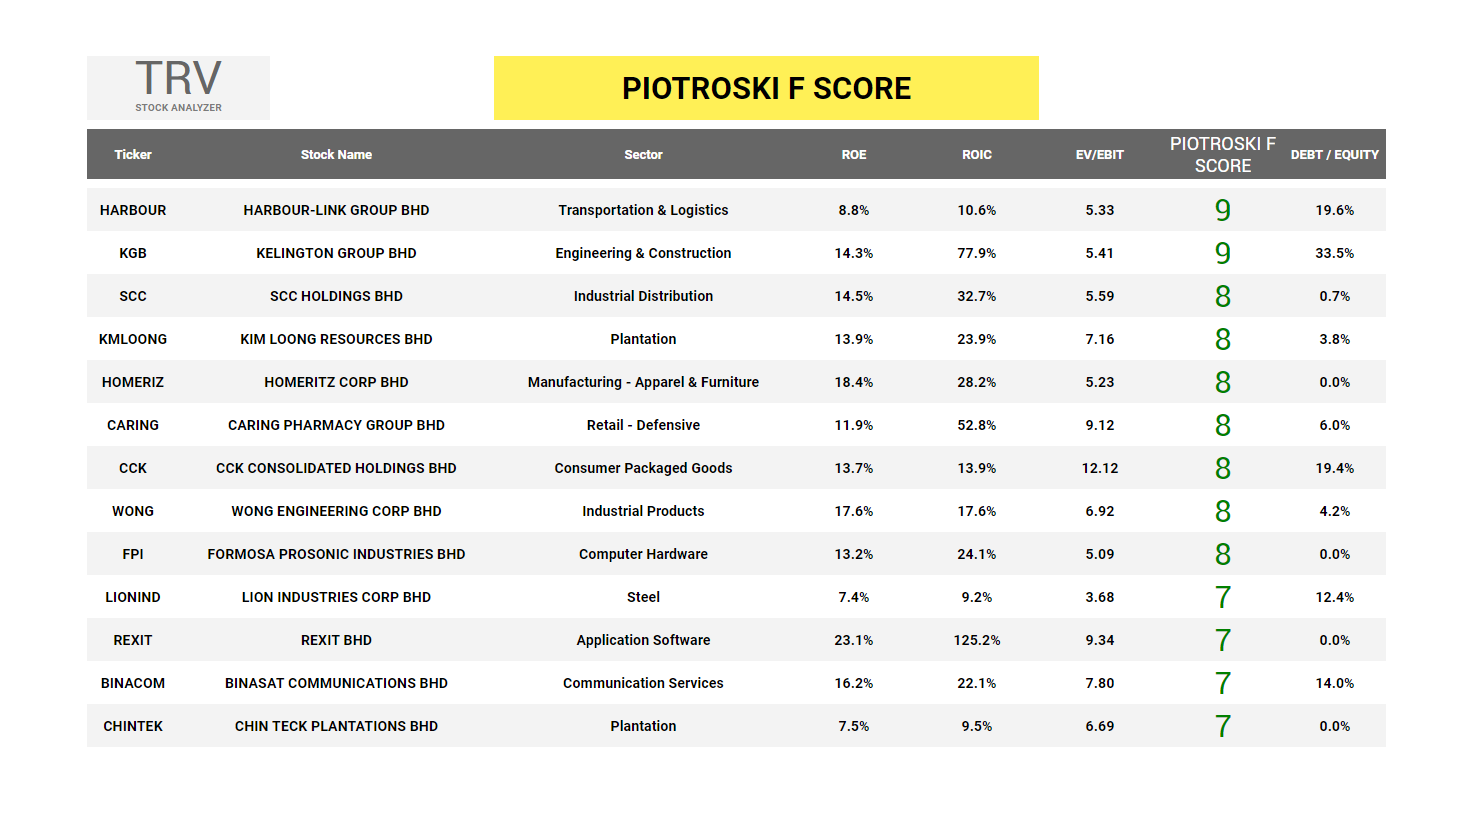
Piotroski regards any stocks that scored eight or nine points as being the strongest.
_______________________________________________________________________
The Piotroski score is a discrete score between 0-9 which reflects nine criteria used to determine the strength of a firm's financial position. It is used to determine the best value stocks, nine being the best. The
score was named after Chicago Accounting Professor, Joseph Piotroski
who devised the scale according to specific criteria found in the
financial statements.
In 2000, he wrote the paper, Value Investing: The Use of Historical Financial Information to Separate Winners from Losers. It
was this paper that outlined 9 fundamental ranking criteria for picking
winning stocks. Using his stock picking criteria, he was able to
theoretically average 23% annual gains between the years 1976 and 1996.
During 2010 as the market sprang back to life, his strategy worked over 5 times better than his previous average.
Piotroski's F-Score involves nine variables from a company’s financial statements. For
every criteria that is met the company is given one point, if it is not
met, then no points are awarded. The points are then added up to
determine the best value stocks. Piotroski regards any stocks that scored eight or nine points as being the strongest.
It should be noted that the nine criteria covers the areas of profitability, capital structure/financial liquidity, and operating efficiency to
decide whether or not a stock has solid financials, and if those
financials are getting better. Therefore, a stock that had an F-score of
eight or nine would pass, and so was considered financially strong and
would be expected to perform well in the future. In general, the
Piotroski screener may have a slight intrinsic bias for value stocks, as
high-growth companies may fail on the Cash Flow and Share Dilution
criteria.
The Criteria
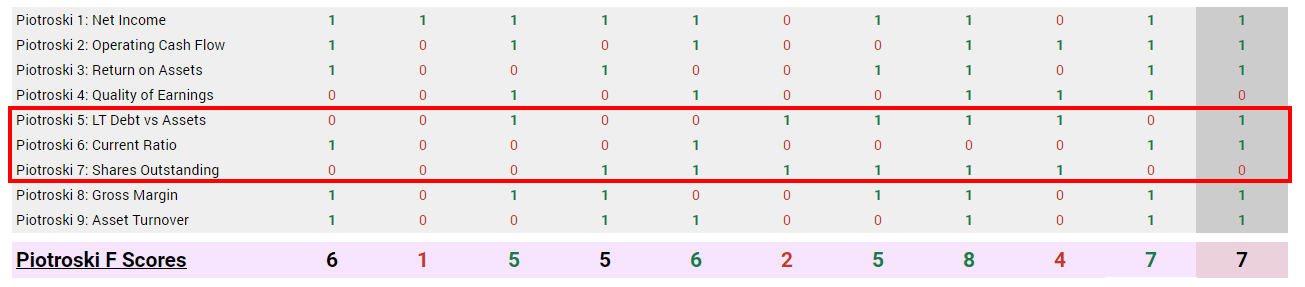
Here are the nine criteria that are used, and why.
Profitability
Piotroski awarded up to four points for profitability: one for
positive return on assets, one for positive cash flow from operations,
one for an improvement in return on assets over the last year and one if
cash flow from operations exceeds net income. These are simple
tests that are easy to measure. Because the requirements are minimal,
there is no need to worry about industry, market or time-specific
comparisons.
- Positive Net Income (Return on Assets > 0)
Return on Assets (ROA) is calculated by dividing Net Income by Total
Assets, so this in effect measures if the company had positive net
income (or profits). It's a straightforward test: financially sound companies should be profitable.
- Positive operating cash flows (Cash Flow > 0)
Cash flow is another (and many believe better) way to gauge earnings,
and measures how much money is going in or out of the business. A positive cash flow ensures that the company is generating enough cash from day-to-day operations in
order to continue its day-to-day operations. A firm can have a positive
net income but negative cash flow, which is why this criterion is
included on top of ROA>0. Additionally, cash flow is harder to manipulate under GAAP than Net Income is.
- Higher return on assets than the previous year (Return on Assets > Last Year's Return on Assets)
This equation measures whether or not the firm is improving its profitability. If the company was less profitable this year than last, it could signal that there are financial troubles to come.
- Quality of earnings. Operating cash flows greater than net income (Cash Flow > Income After Tax)
This equation also measures profitability and is meant to weed out any stocks that may be playing accounting tricks in
order make their earnings appear larger than they are. Because income
has had taxes and depreciation subtracted from it, cash flow is
generally larger than income. If it's not, then it means that the firm
may be shifting earnings forward, thus misrepresenting them in the long
run.

Capital Structure
Piotroski awarded up to three points for capital structure and the firm’s ability to meet future debt obligations: one if the ratio of debt to total assets declined in the past year (change in average), one if the current ratio improved over the past year (change in liquidity) and one if the company did not issue any additional common stock. Since
many low price-to-book-value stocks are constrained financially, he
assumed that an increase in financial leverage, a deterioration of
liquidity or the use of external financing are signs of increased
financial risk.
- Lower debt than the previous year (Long-Term Debt/Total Assets [now] < Long Term Debt/Total Assets [1 year ago])
This ratio targets capital structure. Piotroski was looking for stocks that were decreasing their debt, increasing their assets, or both. In
other words, cases where the ratio of long-term debt to total assets
would be decreasing. Taking on more debt, while not an inherently bad
sign, increases its financial risk and may signal that the company is
not generating adequate cash flow.
- Higher current ratio than the previous year (Current Ratio [now] > Current Ratio [1 year ago])
The Current Ratio is the Current Assets divided by Current Liabilities, and is used to gauge the liquidity of the firm. If
a company is liquid, then it can easily pay its debts. The higher the
ratio, the more liquid the firm (though if it's too high, that can
signal other issues, like an inefficient use of capital.) Like every
accounting ratio, this one does not tell the whole story, but by
requiring an improving current ratio, this criterion ensures that
passing companies will have an increased ability to meet its financial
obligations.
At this point, point 5 and point 6 seems similar dealing with assets
and liabilities, so why are they both needed? Essentially, they deal with different timelines of financial security. Point 5 (Long-Term Debt/Total Assets) looks at a longer time line, and thus deals with solvency, whereas point 6 (Current Assets/Current Liabilities) uses a shorter timeline,
and thus deals with liquidity. A solvent firm has a positive net worth,
whereas a liquid firm is able to pay all of its current bills, and both
are important for financial health.
A company can be solvent (total assets greater than long-term debt) but
still have a liquidity problem, meaning it doesn't have enough cash (or
easily sellable assets) on hand in order to pay its bills. However,
because a solvent company has a more manageable debt load, it's better
able to borrow against its assets to raise cash in the short term. On
the other hand, a company can be insolvent (long-term debt greater than
assets), but still have enough cash or liquid assets on hand to meet all
its short-term obligations. While this company would be able to carry
on with business as usual, it could be headed for financial distress
further down the road. Piotroski was looking for companies that had a
low degree of financial risk in both the short and long runs.
- Less stock dilution than the previous year (Shares [now] < Shares [1 year ago])
This criterion also targets the capital structure by only letting in companies that have not issued any common stock in the past year. In
addition to reducing the value of an investment, share dilution can
signal that the company can't cover its current liabilities, which is
another sign of financial distress.
Efficiency
The remaining two elements examine the changes in the efficiency of operations. Companies gain one point for showing an increase in their gross margin and another point if their asset turnover has increased over the last fiscal year. The ratios reflect two key elements impacting return on assets.
- Higher gross margin than the previous year (Gross Margin [now] > Gross Margin [1 year ago])
Gross Margin (or Gross Profit Margin) is the percentage of revenue
that's left over after paying the costs of producing the goods sold. By
weeding out companies that weren't able to increase their gross margins
in the past year, this criterion selects companies that are becoming
more efficient and thus are expected to be more profitable.
- Higher asset turnover than the previous year (Sales/Total Assets [now] > Sales/Total Assets [1 year ago])
The final criterion in Piotroski's score screens for an increase
in Sales/Total Assets, also known as asset turnover. An increasing
asset turnover ratio signals that the company is able to generate more
sales with their assets, and thus is also a measure of efficiency.
Screening for both measures in the form of an increasing gross margin
ensures that the company is able to keep costs under control, whereas
screening for increasing asset turnover ensures that the company is able
to grow their sales relative to their assets
It's important to note that rather than screen for stocks against a hard value (Gross Margin > 10%, for example), most
of this screener's criteria compare metrics against their values from a
year prior. This is advantageous because many metrics have wildly
different ranges depending on the industry or sector of the company, but
by using criteria based on relative values, this Piostroski screener is
able to pull from all corners of the market.

Conclusion
All of the Piotroski criteria target stocks are increasing their
profitability, increasing their efficiency, and reducing their debt.
More efficiency means more profit, and more profit means higher
earnings, and those are rewarded with a high stock price. Piotroski’s
segmentation of firms by financial strength continues to be helpful in
identifying both potentially attractive stocks as well companies to
avoid. Generally, the higher the F-Score, the greater the average
portfolio return.
Get Piotroski F Score calculated automatically with TRV Stock Analyzer.
http://klse.i3investor.com/blogs/TRV/167333.jsp
http://klse.i3investor.com/blogs/TRV/167333.jsp
