For a copy with better formatting, go here.
2018 Year End Update and Memo to Investors
Dear Fund Unit Investors/IOU Holders
Our performance
As a fund manager of a long only, bottoms up, value oriented fund, it is my expectation and hope (it's always hard to tell which is which) that we will do relatively well compared to the general market in down or static markets, but that we may not look so good in advancing markets. In strongly advancing markets I expect to have real difficulty keeping up with the general market.
However, thus far, this does not appear to be the case for the fund, at least on a surface level, as we will see below.
As most of us are probably aware (considering the sheer amount of panic and talk about a recession these days, it would be hard not to), equity markets around the world have been falling very strongly this year, with many being officially characterised as a bear market (down more than 20% from peak)
For example, the Chinese stock market (Shenzen and Shanghai) has fallen more than 30% from peak, along with the US markets (Nasdaq and S&P500) also having fallen by more than 20% from peak.
For the period under review, 3 January 2018 to 28 December 2018, the benchmark used by the fund, the “FBMEMAS Index” which represents 98% of the market capitalisation of all listed companies in Malaysia, have fallen from 12,930 to 11,537 or 10.77%.
In addition, the “Bursa Malaysia MidS Cap Index”, which consist of companies listed in the BURSA with Market Capitalisation of RM200m to RM2bil and is roughly 70% of our portfolio (and thus a more accurate representation), have fallen from 17,338.5 to 11,709.7 or 32.46% .
This year, the net asset value (NAV) for each fund unit have fallen from RM1.13 to RM0.9272, a fall of RM0.2028 or 17.95%.
This represents an underperformance of 7.18% against the FBMEMAS Index and an overperformance of 14.51% against the Bursa Malaysia MidS Cap Index on our part.
There is a saying by Goethe I particularly like, “When ideas fail, words come in very handy”.
At the end of the day, negative returns are negative returns. Using the Japanese stock market for the last 40 years as reference, one can outperform the market every single year and still lose money
As investors, we expect not just outperformance, but a positive return on our capital over the long term. And as your fund manager and largest unsecured investor in the fund, I intend to provide it.
My continual objective in managing this fund is to achieve not just a long term performance record superior to that of the FBMEMAS Index, but also a positive one. And unless we do achieve this, there is no reason for the existence of this fund.
For our IOU holders, regardless of performance, at minimum, the protection of your capital and interest of 4.5% (0.2-0.3% higher than the highest FD rate in Malaysia) is guaranteed.
A Word About Yardsticks.
As the fund manager, one of the most important matter in relation to my relationship with you, the investor or IOU holder, is to ensure that we both use the same yardstick.
Based on that yardstick, if my performance is poor, I expect partners to withdraw upon the end of the contract period, and indeed, I should look for a new source of investment for my own funds.
If performance is good, I am assured of doing splendidly, a state of affairs to which I am sure I can adjust.
The rub, then, is in being sure that we all have the same ideas of what is good and what is poor. I believe in establishing yardsticks prior to the act; retrospectively, almost anything can be made to look good in relation to something or other.
Since the start of the year, I have used the FBMEMAS Index as our measure of par. It is my feeling that 1 year 8 months is a very minimal test of performance, and the best test consists of a period where the terminal level of the FBMEMAS Index is reasonably close to the initial level, over a length of 5 years or more.
While the FBMEMAS Index is not perfect (nor is anything else) as a measure of performance, it has the advantage of being widely known and used (Pheim Unit Trust uses a benchmark of 60% FBMEMAS Index and 40% Maybank 1 year average FD Rate), has a long period of continuity, and reflects with reasonable accuracy the experience of investors generally with the market.
I have no objection to any other method of measurement of general market performance being used, such as other stock market averages, leading diversified mutual stock funds, bank common trust funds, etc, however, accurate data for these is significantly harder to obtain, with high survivorship bias due to underperforming funds being shuttered.
It is quite common for a bank to launch 30 new unit trust, and only keep the top 3-5 funds with decent track record, while shuttering the rest. Allowing them to report significantly higher performance when the reality cannot be further than that.
Despite our underperformance to the FBMEMAS Index, I do not consider the FBMEMAS Index to be a strong competitor over the long term, as the KLSE is historically known as a “Stock pickers market”, due to higher than usual amounts of mediocre companies, as well as extremely overvalued GLC’s which pulls down prospective growth of the index, thus giving higher probabilities of success to those who are shrewd in their selection of equities.
The above dose of philosophy is being dispensed since I have never properly elaborated on the benchmarks used and why they were chosen, and thus i wanted to take this opportunity to make sure everyone understands my objectives, my measure of attainment of these objectives, and some of my known limitations.
Observations and predictions about the economy.
Regular readers of my letters and articles from the website (I may be flattering myself) will feel I have left the tracks when I start talking about predictions, especially since our investment philosophy consist of analysing from the bottom up (company level) instead of top-down (economic picture and trends).
This is one thing from which I have always shied away and I still do in the normal sense.
However, like any human being, I can discuss our view of the economy and the market. Fortunately for you, i don’t tend to operate based on those view, and at best, only lean on them slightly.
I am certainly not going to predict what general business or the stock market are going to do in the next year or two since I don't have the faintest idea.
However, as my previous two letters this year have touched upon the specifics of some of our current investments, with there being little change in the subsequent months, I think it would be of greater use if I were to try and make some sense over what has been happening over the last few months.
As someone on an investing forum I frequent have said, for most market participants, this year is likely to be and “Annus Horribilis” which is latin, for a horrible year. And they were a few reasons for this.
-
2017 was truly a fantastic year.
As many of you have noticed. Although the performance of stock market is usually tied to the performance in the economy over the long term. Over the short term, this is usually not the case.
In 2017, the Dow Jones Index Average (“DJIA”) rose 25.8% despite the US economy only growing 3.5% or so. Its was spectacular for market participants. We had returns with no volatility, and every single correlation worked.
In 2018, despite the American economy growing at a record pace of 4% or so, with the strongest jobs gains for a long time, the DJIA has fallen by 6.4% and this drop appears unlikely to abate too soon.
At the end of the day, the markets grow in tandem with the economy, any growth far in excess of the growth in the economy/earnings is likely to result in a correction somewhere down the line, unless sudden and extreme productivity gains are obtained.
-
Foreign fund outflow in emerging markets due to rise in US interest rates.
In 2008, interest rates in the US were lowered to around 0.25% to stimulate the economy. And it had stayed there till 2016, when it was gradually hiked to the current 2.5% today.
This interest rate hike, have resulted in foreign funds in emerging countries around the world, flowing back to the US to be invested in “risk free” instruments such as US Treasuries.
Since January, foreign fund outflow from the KLSE alone amounted to RM9.8billion. Another RM3.7 billion, and we would break the record foreign fund outflow for KLSE set in 2009.
Due to prolonged close to zero interest rates along with the USD being the reserve currency of the world, much of the debt worldwide is denominated in USD.
With higher interest rates, along with the appreciation of the USD relative to other currencies due to the increased demand for USD (due to the higher interest rates), this will have resulted in much higher borrowing cost for many companies.
Therefore, foreign companies with USD denominated debt will now be a lot more motivated about paying back the debt or speeding up the repayment schedule. And this creates even more demand for the USD and results in the currency rising which the further increase the debt, and thus further motivate repayment and repeats ad nauseum.
To understand this a little better, you can read this.
Demystifying the under-performance of the KLSE versus other markets (NASDAQ, S&P, SGX, NIKKEI etc)
This strong selling have resulted in equity valuations in emerging markets such as ours falling to unduly low levels.
Ironically, it is this incredible cheapness now, that gives me the increased expectations for favourable returns in the years moving forward.
- The ongoing trade war between China and the US
One of the reason for the current market volatility and uncertainty is due to the ongoing trade war between China and the US.
Since 9 December 2018, the trade war has been put on pause for 90 days while negotiations continue, with the new deadline being 9 March 2019.
Since 9 December 2018, the trade war has been put on pause for 90 days while negotiations continue, with the new deadline being 9 March 2019.
Being
a small country wedged between two much larger powers, their actions
towards each other will naturally influence us. However, to be honest,
whether two elephants make love or war, the grass (Malaysia) is still
going to be affected.
And personally, I don’t view this trade war as having particularly adverse effects, for Malaysia, and may even be beneficial to some extent, with production being moved out of China to markets such as Vietnam and Malaysia.
You can read some of my thoughts here.
Trade Wars, Bear Markets and Getting Trapped.
My thinking now is largely similar with my thinking then, when the article was written.
At
the end of the day, this is a money problem. It is not an emotional,
religious or race problem. Unlike the other types of problems which have
no solutions, as no one can compromise without going to hell. Money
problems have historically been solved relatively quickly.
- The victory of Pakatan Harapan in GE 14.
With
the victory in GE 14 by Pakatan Harapan. Most of what is rotten in the
Malaysian economy have been brought to light, and the smell from these
festering wounds now reach the high heavens.
Given the amount of coverage given by the news towards these matters, I do think it is necessary to elaborate.
In
the short term, markets are governed more by people’s perception of the
economy instead of its actual health. And the public airing of these
dirty laundry have certainly done no favours for the market in the short
term.
Over
the long term, however, I believe the Malaysian economy’s prospect have
never been better. Now that these festering wounds, have been reopened,
with painful but effective medication applied, the healing and
subsequent vigour of the economy can now begin.
You can read about my in-depth thoughts on this matter here.
PH Win, I Called It!! Whats next?
The Malay Tsunami and the effects of elections on the economy (and by extensions, the market)
PH Win, I Called It!! Whats next?
The Malay Tsunami and the effects of elections on the economy (and by extensions, the market)
- Recession
One
of the most common talk we see these days on financial news, is how a
recession is imminent, and would likely occur in the next year or
sooner.
The
first question is then, as per the theory of reflexivity, the
conditions of the market changes according the actions of the market
participants.
If
everyone is fearful, well in advance of any major and sudden changes in
the economy, and thus become much more prudent in their actions,
wouldn’t this reduce the probability of a recession happening?
The
second question is this, if an economic crisis were to occur. Would
holding cash be the correct move? What if the recession is inflationary
and not deflationary? And thus, severely destroys the value of cash?
They are two kinds of recession (I’m generalizing heavily), the first being inflationary and the second deflationary.
Recessions
often occur when the productivity per dollar borrowed is no longer
higher than the principal and interest cost. This gives rise to a
liquidity and equity crunch, when the profit from each dollar borrowed
is not enough to cover the principal, or worse even the interest cost.
Since
1930, most recessions (other than those in Zimbabwe, Venezuela) etc
have been deflationary. We are currently at a point where, there isn’t a
single generation that does have lived through a depression or
inflationary recession.
Thus far, most recessions since 1930 have been deflationary.
In this scenario, the country holds debt primarily denominated in their currency. In an economic downturn, when the country or companies are unable to pay back this debt, the central bank can just print money to purchase these debts. While the printing of money is inherently inflationary, it is counteracted by the forgiveness of debt and purchase of these debt by the central bank, which is deflationary.
In this scenario, the country holds debt primarily denominated in their currency. In an economic downturn, when the country or companies are unable to pay back this debt, the central bank can just print money to purchase these debts. While the printing of money is inherently inflationary, it is counteracted by the forgiveness of debt and purchase of these debt by the central bank, which is deflationary.
The pain is therefore absorbed by the central bank to be spread out over a longer period.
An
inflationary recession on the other hand, is when a country holds a lot
of foreign debt, and in an economic downturn, they become unable to pay
back these debts.
As the debt is in a foreign currency, they cannot print currency to buy over these debts or forgive it.
However,
as the alternative of an instant and complete breakdown of the
financial system is far worse, Central Banks will typically decide to
print these currencies and try to purchase foreign currencies with it.
The
incredible boost in supply, coupled with a low demand, due to the
outflow of currency from its own citizens and foreign investors, as there is no longer any faith in the ability of the government to pay back its debts and back its currency, results in not just inflation, but hyperinflation.
Only
those holding commodities or foreign currencies have good outcomes in
times of hyperinflation. Equity holders do not do as well, but far
better than cash holders.
Why all this talk about hyperinflation? Isn’t the US the largest economy in the world?
Well,
in 2008, during the recession, what happened was relatively straight
forward, the amount of money borrowed (with extremely lax standards) and
invested into housing, gave returns far below the amount needed to
cover even the interest cost, and thus resulted in a crash.
It
also did not help that corporate debt and leverage were close to all
time high. The US government had no choice but to make guarantees for
money market funds, purchase toxic assets, and inject equity and
liquidity via money printing by the Federal Reserve. The European
Central Bank soon followed.
And
china, the only country then with significant savings then, ploughed
that money into supporting the economy. Even China is currently in debt.
What
happened was debt that was in private hands, were passed into public
hands globally, none more than what happened in 2008. And regardless of
who is holding it, all debt must be paid.
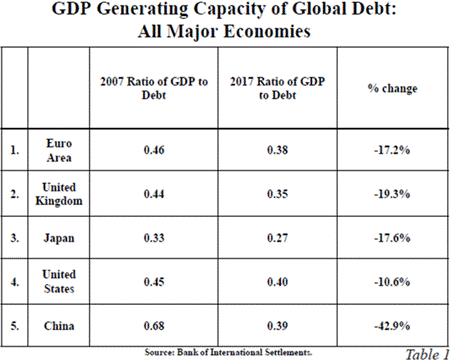
These
days, according to data by Bank for International Settlements, debt is
losing its ability to stimulate growth. In 2017, one dollar of
non-financial debt generated only 40 cents of GDP in the US and even
less elsewhere. This is down from more than four dollars of growth for
each dollar of debt 50 years ago.
This
has significantly worsened over the last decade. China’s debt
productivity dropped 42.9% between 2007 and 2017. That was the worst
among major economies, but others lost ground, too. All the developed
world is pushing on the same string and hoping for results like we saw
40–50 years ago.
The US
Government is currently USD24.5 trillion in debt (both federal and state
debt, not including off balance sheet items, unfunded pensions and
social security which can easily add on another USD30-200 trillion,
depending on who you ask ).
Refer to here.
The
yearly US government deficit for 2018 is currently USD1.3 trillion
(including off balance sheet items) and projected to rise USD1.5
trillion by 2028 by the Congressional Budget Office.
This
projection appears to be highly optimistic as it assumes zero
recession, and deficit projections by most people for 2019 appears to be
USD1.5 trillion.
Interest
expense on all these debt is currently $263 billion, or 1.4% of GDP.
The Congressional Budget Office expects it will rise to $915 billion by
2028, or 3.1% of GDP.
From
what we can see, the US will need to keep borrowing vast sums of money
from the rest of the world via treasury bond sales to keep the
government running.
And
for the last few decades, given the US’s exorbitant privilege as the
reserve currency in the world, they never had a problem when it comes to
borrowing money.
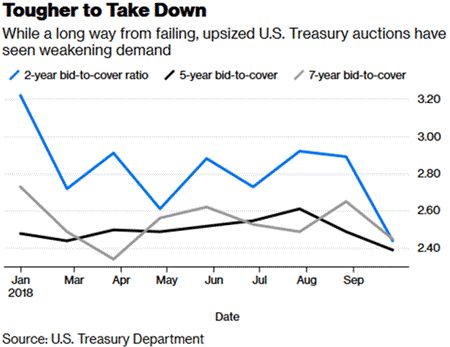
Except,
demand for increasingly large Treasury auctions have seem slowing
demand. With both China and Japan not participating in the last auction.
In
addition, due to the low interest rates of the last decade, as well as
higher hedging cost, European, Chinese and Japanese investors can no
longer buy US Treasury debt at a positive rate of return, unless they
want to take currency risk, which most do not. This is a new
development.
To
borrow to more, the US government will likely need to offer
increasingly higher interest rates. And as all the debt held by the US
government is in USD with interest rates linked into US Federal Fund
rates. Interest cost for the government will likely skyrocket, and thus
require even more borrowing at higher interest cost, fuelling a vicious
cycle.
In
addition, as most of the debt held by corporate America have risen to
USD 9.2 trillion in 2018, compared to USD 4.9 trillion in 2007
pre-crisis, due to the low interest rates. Things will likely turn out
to be very interesting as all the interest cost of all these floating
rate debt increase.
Who will save the US if the US can no longer save itself by selling debt at extremely cheap rates?
What would happen if countries and people stop believing in the US’s ability to pay back its debt and back its currency?
I’m
leaning towards an inflationary kind of recession/depression, and in
times like those, I would rather be holding equities than cash.
There is a saying by Warren Buffet I particularly enjoy,
“Forecasts may tell you a great deal about the forecaster; they tell you nothing about the future.”
My treatise on the economy above may at times border on the ramblings of an overactive and overanalytical mind.
After all, if you have an economist on your payroll, you probably have one staff to many.
Fortunately, as your fund manager, I do not invest based on my macroeconomic understanding and forecast, at best, I lean on it slightly.
If anything, the bearish market of 2018, and hopefully 2019 and 2020 are very good things for those such as us, who are likely to be long term buyer of stocks. It’s very simple, lower prices allow you to buy more stock.

These people resemble a car driver who rejoices after the price of petrol increases, simply because his tank contains a week's supply.
Fear is the foe of the faddist, but the friend of the fundamentalist.
Given the long-term nature of the fund, our low leverage policy, our discipline in only investing in companies that meet our increasingly strict criteria’s, and ensuring that our investments are generally good to great businesses with good capital structure that won’t go bust in the trough and bounce back fantastically when things turn around. It makes me optimistic for the years and years ahead.
Overall, as your fund manager, I remain grateful for your support, and will continue working hard to continue to merit your confidence.
The current shareholding of the fund is as follows.
|
Name
|
Percentage
|
|
XX
|
30.50%
|
|
XX
|
19.81%
|
|
XX
|
17.34%
|
|
XX
|
8.20%
|
|
XX
|
3.69%
|
|
XX
|
3.32%
|
|
XX
|
2.48%
|
|
XX
|
2.38%
|
|
XX
|
2.20%
|
|
XX
|
1.90%
|
|
XX
|
1.90%
|
|
XX
|
1.89%
|
|
XX
|
1.78%
|
|
XX
|
1.49%
|
|
XX
|
1.34%
|
|
XX
|
1.33%
|
|
XX
|
1.29%
|
|
XX
|
1.11%
|
|
XX
|
1.10%
|
|
XX
|
1.08%
|
|
XX
|
1.06%
|
|
XX
|
1.02%
|
|
XX
|
0.85%
|
|
XX
|
0.79%
|
|
XX
|
0.64%
|
|
XX
|
0.56%
|
|
XX
|
0.39%
|
|
XX
|
0.39%
|
|
CASH
|
0.79%
|
|
MARGIN LOAN
|
-12.60%
|
|
TOTAL
|
100.00%
|
|
Fund Performance To Date
|
|||
|
Period
|
Fund Returns
|
FBMEMAS Index
|
Over/(Under) Performance
|
|
21/3/2017-3/1/2018 |
12.22%
|
4.22%
|
8%
|
|
3/1/2018-30/12/2018 |
(17.95%)
|
(10.77%)
|
(7.18%)
|
=====================================================================
Facebook: Choivo Capital
Website: www.choivocapital.com
Email: choivocapital@gmail.com
Website: www.choivocapital.com
Email: choivocapital@gmail.com
