Comment what stock you like us to cover below for the next article....
Sapura Energy (SAPNRG) Berhad (5218.KL) listed in the Bursa Malaysia
Background of Sapura Energy (SAPNRG) (5218.KL)
Sapura Energy was listed on the Bursa Malaysia on May 2012 with a reference price of RM2.00. Sapura Energy is a leading global integrated oil and gas services and solutions provider operating across the entire upstream value chain. It operates in various geographical areas in the world, including Malaysia, Asia, Australia and Russia, Americas and the United Kingdom, and Africa.At the end of FY2019, Sapura Energy’s order book was recorded at RM17.2 b (FY18: RM14.9 b) at the end of FY2019 with 70 percent of the work in global market.
Sapura Energy’s revenue fell 22.5% yoy to RM4568.4 m in FY19. Core net loss widened by 7.6% yoy to -RM2605.1 m in FY19 from -RM2421.0 m in FY18, excluding RM2.6 b of disposal gain from OMV. The weak performance was mainly due to lower contribution from the E&C and Drilling segments. Finance cost increased by 18.2% yoy. The resultant adjusted FY19 EPS stood at -16.3 sen.
Recent Insider Report for Sapura Energy (SAPNRG) (Bursa Malaysia)
With the divest of investment of Norges Bank Investment in the Insider Report, we saw more US based fund management like Vanguard Group (founded by John Bogle, value investor based in US) and BlackRock Investment Investment UK (US, one of largest financial asset management company) taking 1% respectively in Sapura Energy Berhad (SAPNRG) within the Insider Report of the Bursa Malaysia.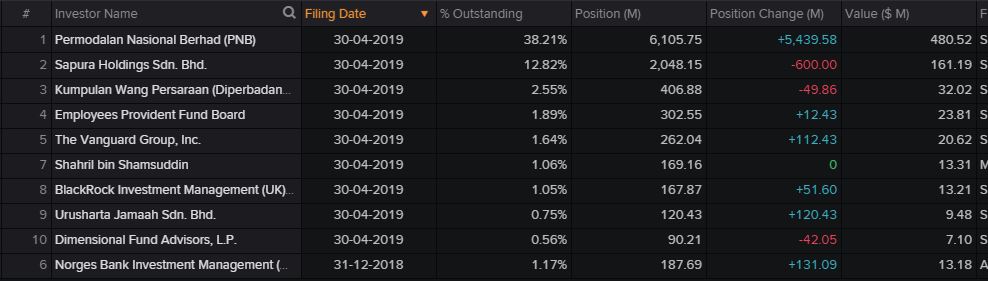
It’s interesting to note in the Insider Report, I didn’t see major selling except Sapura Holdings, parent company of SAPNRG listed in Bursa Malaysia for more of a rebalancing of their current position. With the majority of filling date of shareholders taking fresh position as shown in Insider Report by EPF Board, BlackRock, Vanguard and Urusharta Jamaah S.B on 30 April 2019 @ 0.33-0.34, this solidified the longer view taken by these longer term financial institution.
Interesting to note that Urusharta Jamaah is the special purpose vehicle (SPV) set up by the Ministry of Finance to receive the pilgrims fund’s underperforming assets transferred from Lembaga Tabung Haji’s (TH) equities portfolio. You can learn a lot of its motive if you know who is the owner behind these companies in the Insider Report
From the Insider Report alone, if you add the long term allied of Sapura Energy Berhad (EPF, PNB, Sapura Holding, KWAP, Urusharta and Sapura Energy big boss, Shahril bin Shamsuddin) within Bursa Malaysia, you get 58.3% total share of the floating share 72% supply, you will end up with a figure of 81% is controlled with people with the same interest. So I will say at the base RM0.27-RM0.28 is a good support price level. Risk to downside is low with higher crude oil and rationalization plan to bring Sapura Energy Berhad back to black amongst the companies listed in Bursa Malaysia
Known Major Shareholder(s), As of 30th Apr 2019
26.93% Amanah Saham Bumiputera
12.82% Sapura Holdings S.B
* Group CEO and his brother are deemed interested.
Market Cap: RM 4.554 B, Number of Shares: 15,979 M, Floating shares : 72%.
Profitability Analysis of Sapura Energy
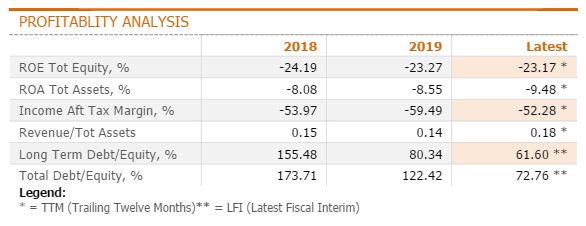
The continual loss over 2018-2019 of Sapura Energy Berhad (SAPNRG) give the loss making Sapura Energy large oil and gas player that it can never return to black. With higher crude oil projection after Saudi oil field attack, we see possibility return of equity turning positive soon. Right now, Sapura Energy is a recovering share play.
Weekly & Daily Chart VSA (Volume Spread Analysis) Review
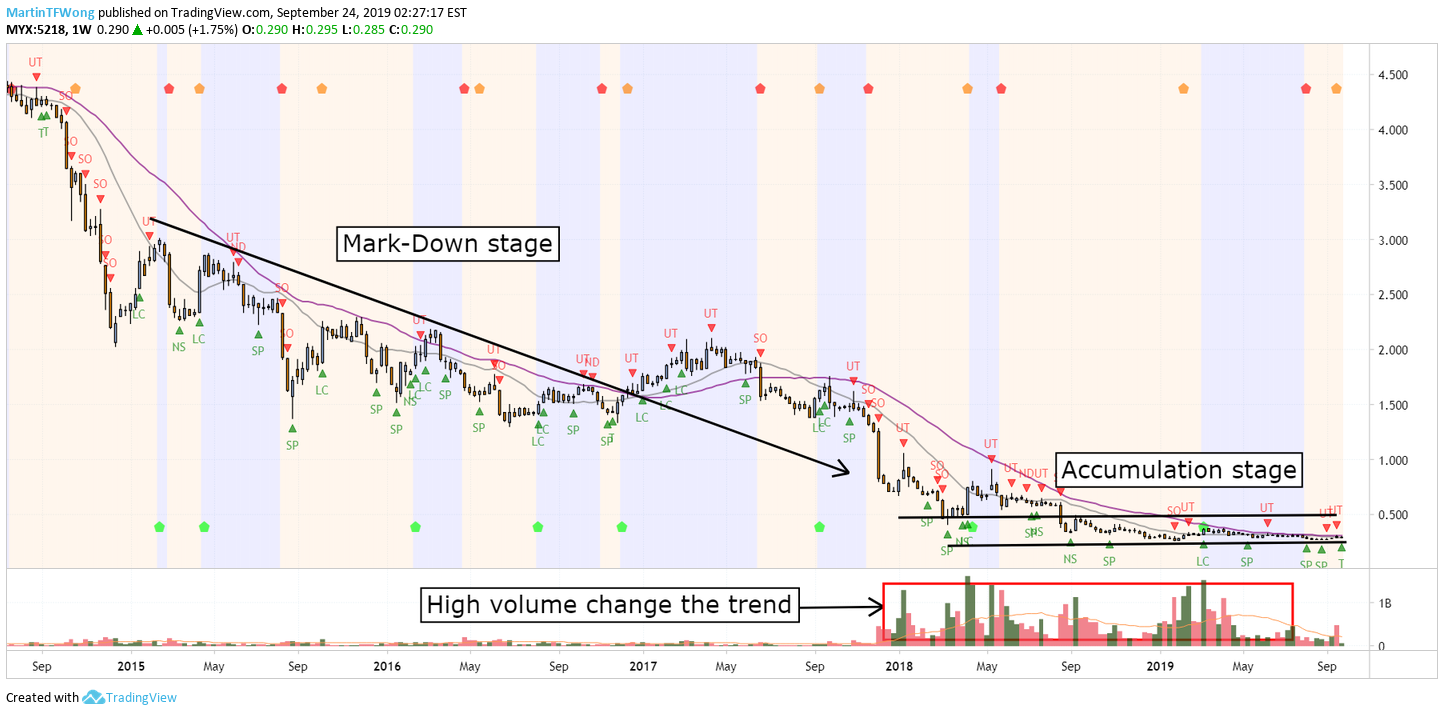
Weekly chart of Volume Spread Analysis in Sapura Energy alerted us a signal of change in the trend since early of December 2017. The spike in volume towards the end of the mark-down stage show activities by Smart Money subsequently change the direction of the price to accumulation stage.
The accumulation is well supported with 4 Spring signals at price level near RM0.265. We notice average volume getting lower each week starting May 2019. The low volume in accumulation show potential lack of supply in Sapura Energy’s Volume Spread Analysis chart.
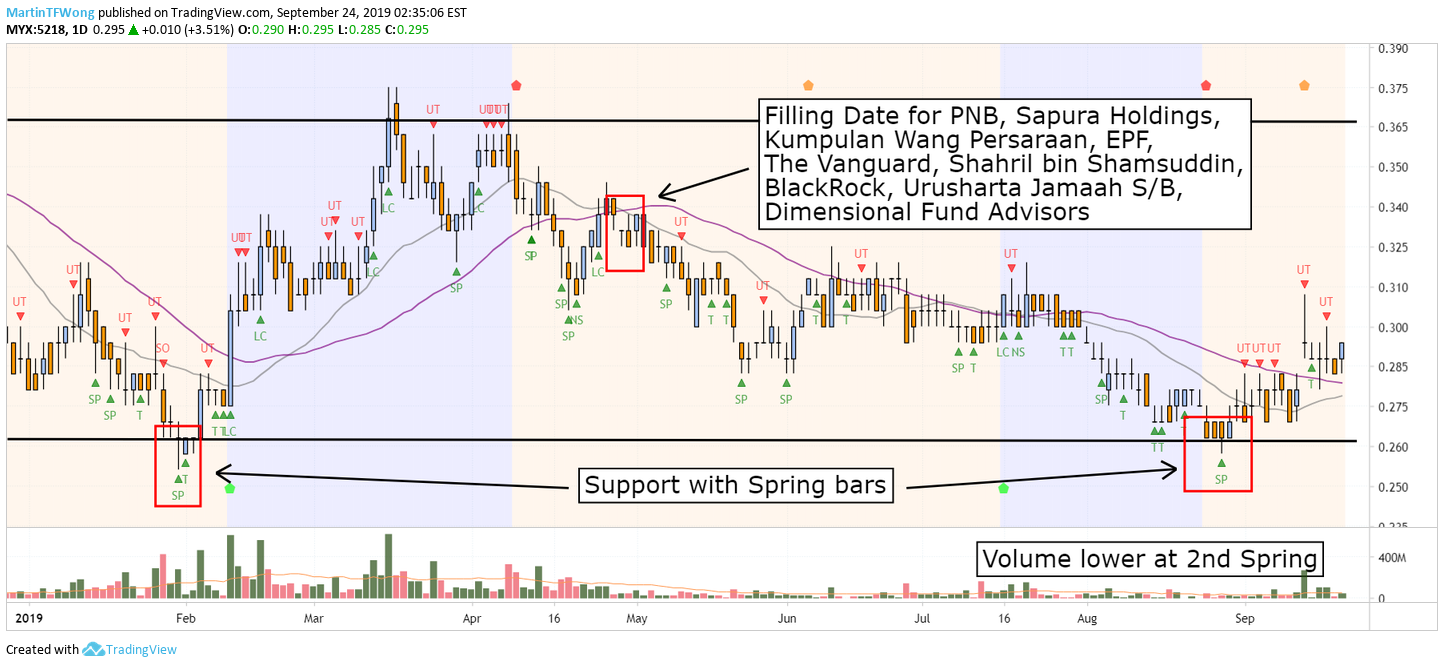
The Volume Spread Analysis (TradeVSA) daily chart shows pretty clear support too in the accumulation. Notice in the daily Sapura Energy chart, there are 2 Spring bars at the support level RM0.265. This is the potential shakeout area by Smart Money to remove weak hand holders.
The 2nd Spring bar show volume getting lower too. However, we prefer to trade in the bullish trendzone with next confirm strength. The price likely to re-test the resistance at RM0.37 soon.
*Pentagon Guider System has Buy or Sell Indicator indicated by Green Pentagon Icon and Red Pentagon Guider Icon in the field of Volume Spread Analysis. However, we advised reader that not all pentagons are buy or sell taken literally 100% of the time in Volume Spread Analysis method.
Check out our track record of our stock trade ideas of TradeVSA, Insider Report discussion here : http://bit.ly/2lUfUjY
Contact us via: email at support@tradevsa.com or Call/WhatsApp at +6010 266 9761 if you have any queries about this Sapura Energy (SAPNRG) (GENM) Group and its Insider Report article or opinion to clarify.
Invite all of you to Market Conference 2019, Oct 19 2019 TradeVSA for your next Event !
Improve your Financial Literacy & learn new Research/Insights of Investing and Trading from Insider Report perspective from our panel of speakers Oct 19, 2019 Market Conference 2019, co-partner with Macquarie Malaysia and media partner with TradingView. Early Bird Tickets available to 30 Sep 2019 !
https://www.eventbrite.sg/e/market-conference-2019-tickets-70882582713
Join our FREE Education via Telegram Channel: https://t.me/tradevsatradingideas
