Dear valued readers,
Jaks had been an up trending stock
since 8/10/2019, no one can refuted it if you know to read technical
chart correctly. Enclosed is the technical chart of Jaks for your
perusal.
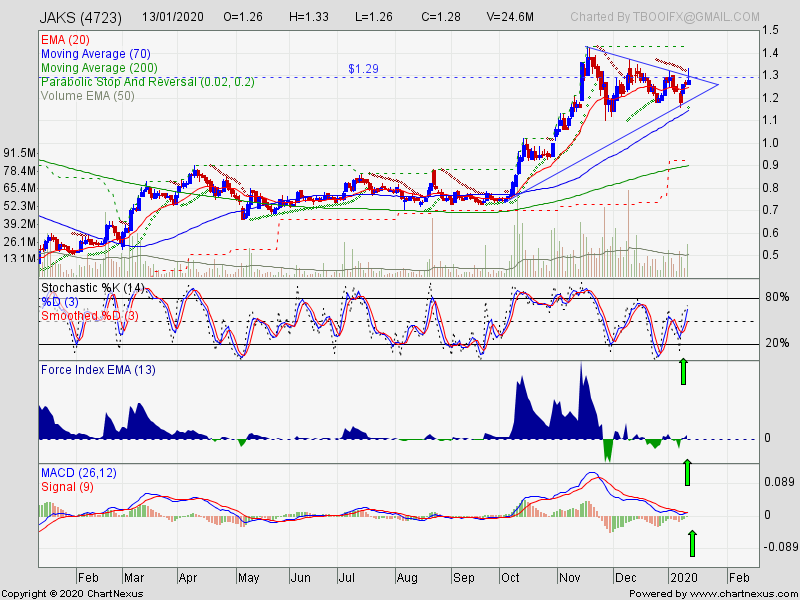
TA reading
- The share price of Jaks was breaking new high at 1.43 on 18/11/2019.
- The share price had breakout from "Golden Cross buy signal i.e. 20-day EMA crossed above 70-day SMA" on 8/10/2019 at 0.78 which was very bullish.
- The price is above 20-day EMA, 70-day SMA and 200-day SMA now.
- MACD buy signal will appear once the share price of Jaks closes above 1.29. I like this buy signal to appear because the Blue and the Red lines of MACD are staying above zero level to show a stronger momentum.
- Stochastic, Parabolic SAR and Force Index, all showed buy signals which are bullish.
- Weekly MACD also showed a buy signal, this technical chart will be bullish for a long time.
3 important features appeared in the technical chart
I want the following features to appear in the technical chart so that the probability to win on this stock is very high.
- The Golden Cross of 20-day EMA to cut above 70-day SMA had been formed on 8/10/2019.
- The share price of Jaks to be higher than 70-day SMA to create a 3-month high.
- The Blue and the Red lines of MACD must stay above zero level to show a stronger momentum.
My comment
- In order for the share price of Jaks to move up north, the share price must close above 1.29 and crossed above "Overhead Resistance Trend line" (upper trend line of the ascending triangle).
- The ascending triangle is well formed.
- Look at the apex of the ascending triangle, a major decision has to be made before 27/1/2020.
- If the share price moves up north above "Overhead Resistance Trend line" (upper trend line of the ascending triangle), the share price will likely to move up north to challenge the all time high price at 1.43.
- If the share price moves down below the support line of the ascending triangle, it means the share price needs more time to consolidate further.
- Look at the share price of Jaks is above 20-day EMA, Stochastic Index, Force Index, MACD and Parabolic SAR, all are showing buy signals. I believe the share price of Jaks will cross 1.29 convincingly within next few days.
- All indicators are showing buy signals supported by high volume today, I believe the probability for the share price of Jaks to break above 1.29 is very high.
I just tell you what this technical chart is telling me, if you disagree, please ignore this posting.
Final decision to buy is always yours.
I take this opportunity to wish all readers in I3 "A Happy And Prosperous Chinese New Year 2020".
Thank you.
 OTB
OTB
寧可天下人負我, 休教我負天下人
Disclaimer :
Please
be informed that the aforesaid stocks are solely for the purpose of
education only ; it is neither a trading advice nor an invitation to
trade. For trading advice, please speak to your remisier or dealer
representative.
Final decision to buy is always yours.
https://klse.i3investor.com/blogs/OoiTeikBee/2020-01-13-story-h1482152093-According_to_TA_the_share_price_of_Jaks_must_cross_1_29_in_order_to_mov.jsp
