Kotra Industries Berhad (KOTRA) is engaged in pharmaceutical and healthcare products manufacturing and trading business. KOTRA had a research and development facility in Cheng, Melaka. KOTRA has 51 members working in R&D in 2020 which will be able to launch an average of 4 products over the 5 years; 2016 - 6 products, 2017 - 7 products, 2018 - 3 products, 2019 - 3 products and 2020 - 2 products.
KONTRA have 3 brands of products
Appeton
Nutraceutical product focus on preventive healthcare
consist s of 21 different health supplement products for children, expectant mothers and senior
Axcel
Specialise in paediatric care, anti infective, dermatological and gastroenterology
Vaxcel
Specialise in sterile antibiotic injection
KONTRA has completed Metered Dosage Inhaler Line and Pre Filled Syringe Manufacturing Line, a pioneer initiative in Malaysia and had obtain approval from National Pharmaceutical Regulatory Agency in 2019, 2 years delay from the expected completion date on 2017.
Income Statement
KOTRA 5 years CAGR of Nett Profit increased by 30.67 % although the revenue only had a 1.40 % increase. This is mainly because KOTRA managed to reduce its cost of good sales while keeping its operating expense constant around RM 100,000,000 over the 5 year. KOTRA profit margin had increase from 4.84 % in 2016 to 17.21 % in 2020.
KOTRA revenue is derived 57 % from the local market and 43 % from the overseas market.
Balance Sheet
KOTRA deferred tax assets had increased from RM 1,034,000 in 2019 to RM 4,797,000 in 2020. 43 % of the KOTRA trade receivable in 2020 had past due. KOTRA debt had reduced significantly over the year from RM 96,930,000 in 2016 to RM 32,300,000 in 2020.
KOTRA had a current ratio above 1 over the past 5 years and increased over the years. KOTRA cash/current ratio had increased from 28.48 % in 2019 to 42.71 % in 2020.
Cash Flow
KOTRA has had positive cash flow from operation for the past 5 years and 5 years CAGR of cash flow from operation is 14.01 %. KOTRA had positive cash flow from investing in 2020 is due to withdrawal of fixed deposits for RM 14,000,000.
Asides that, KOTRA has a 5 years CAGR of free cash flow of 23.86 % which is about the same as the 5 years CAGR of price which is 23.75 %.
Per Share Analysis
As of 30 June 2020, there are 5,187,600 number of the Employee Share Option Scheme (ESOS) outstanding until 2023 about 3.57 % of the share outstanding.
Dividend
KOTRA had high dividend payout of 44.29 % for the year 2020. KOTRA start paying out dividend from 2017. KOTRA had increased its dividends every year since it pay dividend in 2017.
Research Report
No Recent research report
Peer Analysis (Pharmaceuticals)
KOTRA P/E is quite low compared to its peers. Only YSPSAH had lower P/E compared to KOTRA. Asides that KOTRA had high dividend yield compared to its peer.
Technical Analysis
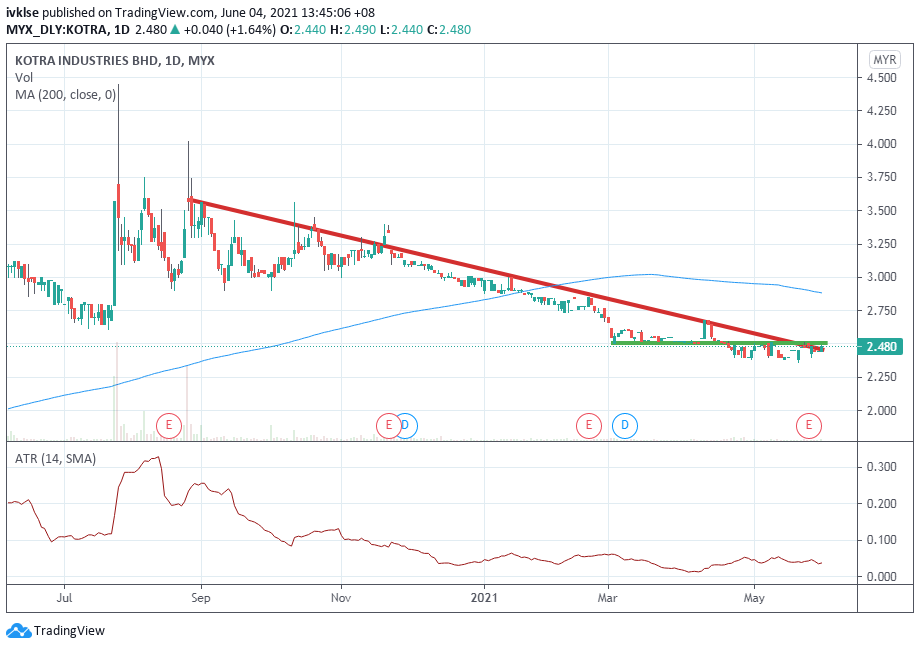
KOTRA daily chart show a downward trench testing support of RM 2.52. If price break above RM 2.52 there might be a reversal.

KOTRA weekly chart also shows a support level at RM 2.27.
http://ivkls.blogspot.com/2021/06/stock-review-kotra-0002-kotra.html
